
FIGURE 5.
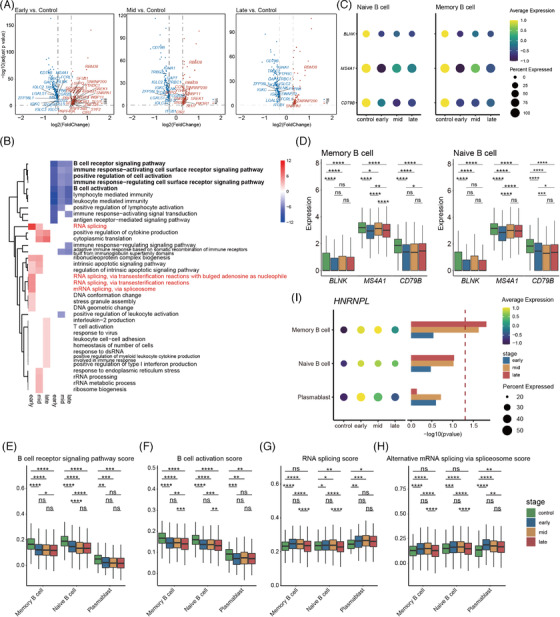
Dynamic functional changes in B cells during pregnancy. (A) Volcano plots of DEGs in B cells (naïve B cells, memory B cells and plasmablast). Genes with |log2(FC)| ≥ 0.3, adjusted p < 0.05, related B‐cell activation and RNA splicing were labelled by gene symbols. (B) GO term enrichment of genes which highly expressed in different trimester compared to non‐pregnancy in B cell. Red means up‐regulation compared to non‐pregnancy, blue means down‐regulation compared to non‐pregnancy. (C) Dot plot of BLNK, MS4A1 and CD79B in naïve B cells and memory B cells. Dots sizes represent the proportion of cells expressed in four stages. Dot colours represent average expression levels of monocytes in four stages. (D) Box plots of the cell scores of BLNK, MS4A1 and CD79B in naïve B cells and memory B cells. Wilcoxon rank‐sum test was applied. (E and F) Box plots of the cell scores of two GO biological process terms (B‐cell receptor signalling pathway and B‐cell activation) in naïve/memory B cells and plasmablast across four conditions. (G and H) Box plots of the cell scores of two GO biological process terms (RNA splicing and alternative mRNA splicing via spliceosome) in naïve/memory B cells and plasmablast across four conditions. (I) HNRNPL expression pattern across four conditions; the graph on the right shows the significance of three periods of pregnancy compared to non‐pregnant controls. Wilcoxon rank‐sum test was applied. All differences with p < 0.05 are indicated. * p < 0.05, ** p < 0.01, *** p < 0.001, **** p < 0.0001, ns = not significant