FIGURE 7.

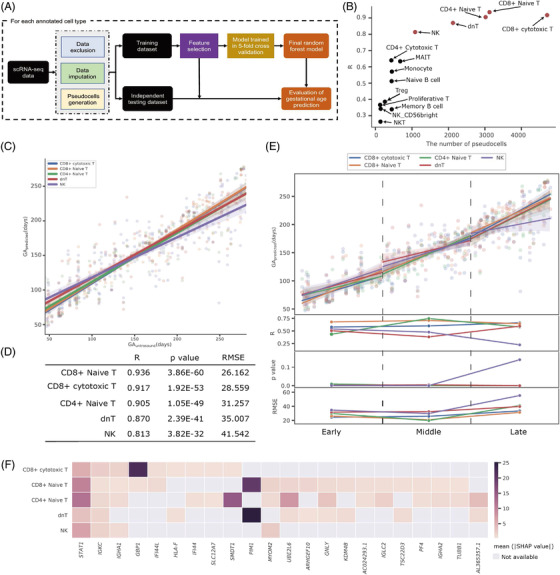
Machine learning models to establish transcriptomic clock of normal pregnancy. (A) Flowchart of developing the cell‐type‐specific machine learning models. (B) Pearson's correlation coefficient (R) values demonstrating the correlation of the predicted gestational age in days () by the 14 cell‐type‐specific models based upon the independent testing datasets with the estimates by the first‐trimester ultrasound (). The x‐axis represented the number of pseudo‐cells. The red circle points indicated the five models with the R values greater than 0.8. (C and D) The correlation of the by the five predominant cell‐type‐specific models with the during the entire pregnancy period (C), as well as the performance metrics in terms of R values, p values and root mean squared errors (RMSE) (D). (E) The correlation of the with the (plot in the first row), R values (plot in the second row), p values (plot in the third row) and RMSE values (plot in the last row) during the periods of early, middle and late pregnancy. (F) Top 22 genes involved in at least two of the five predominant cell‐type‐specific models were ranked and were prioritised by the mean absolute of SHAP values. The first two genes of STAT1 and IGKC were involved in all five predominant cell‐type‐specific models
