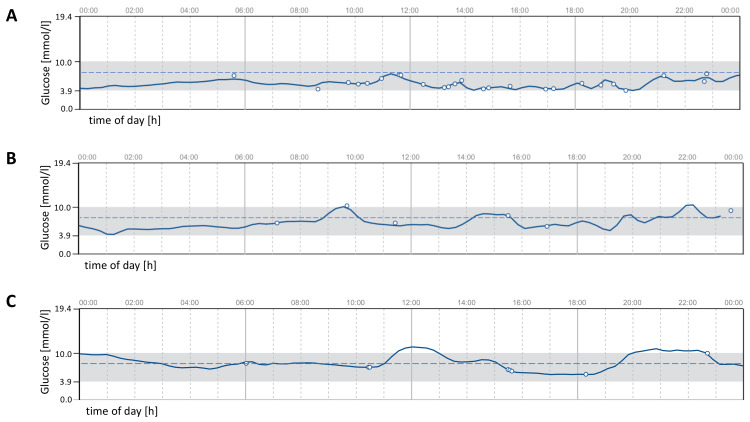
Figure 1. Exemplary real-life glucose profiles of participants with (A) complete and (B) partial diabetes remission or (C) an improved type 2 diabetes at the post-intervention visit.
The dotted blue line represents a glucose value of 7.8 mmol/l (140 mg/dL). The graphics shown above are adaptions of the ambulatory glucose profiles generated by LibreView® (Abbott Diabetes Care, Alameda, CA, USA).

