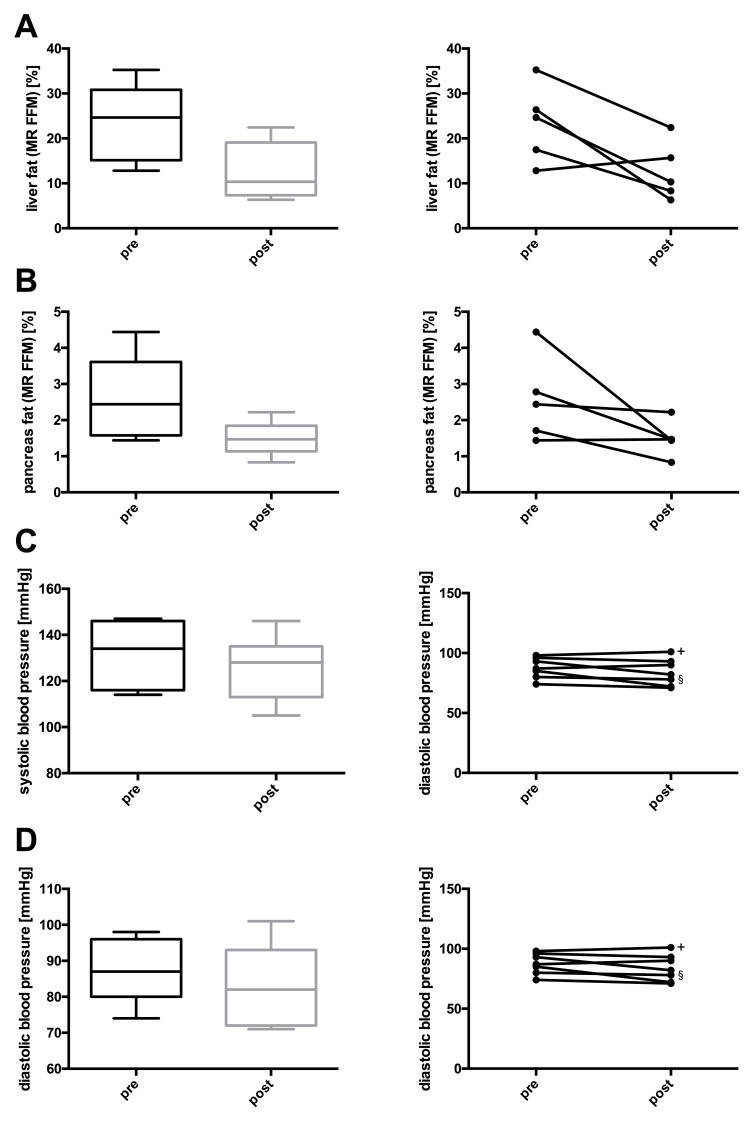
Figure 4. Changes in (A) liver fat, (B) pancreas fat, (C) systolic blood pressure, and (D) diastolic blood pressure before and after lifestyle intervention.
Left panel (A-D): boxes represent the first quartile to the median and the median to the third quartile. Whiskers extend to the minimum and maximum values. Right panel (A-D): individual participants before and after the intervention. * P < 0.05; + discontinued blood pressure medication; § blood pressure medication cut in half.

