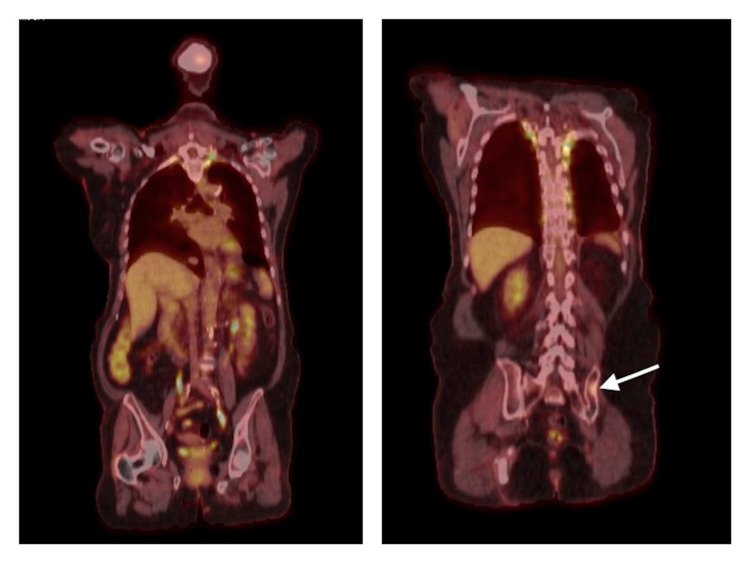
Figure 2. PET-CT scan from June 2020.
Left: PET-CT scan from June 2020 following initiation of systemic chemotherapy, revealing resolution of left hilar and subcarinal FDG-avid lesions without new hypermetabolic disease. Right: PET-CT scan from June 2020 following initiation of systemic chemotherapy, demonstrating significantly decreased FDG activity within previous left iliac sclerotic lesion (as indicated by white arrow). PET-CT: positron emission tomography-computed tomography, FDG: fluorodeoxyglucose.

