. 2019 Nov 29;9(67):39338–39347. doi: 10.1039/c9ra07036b

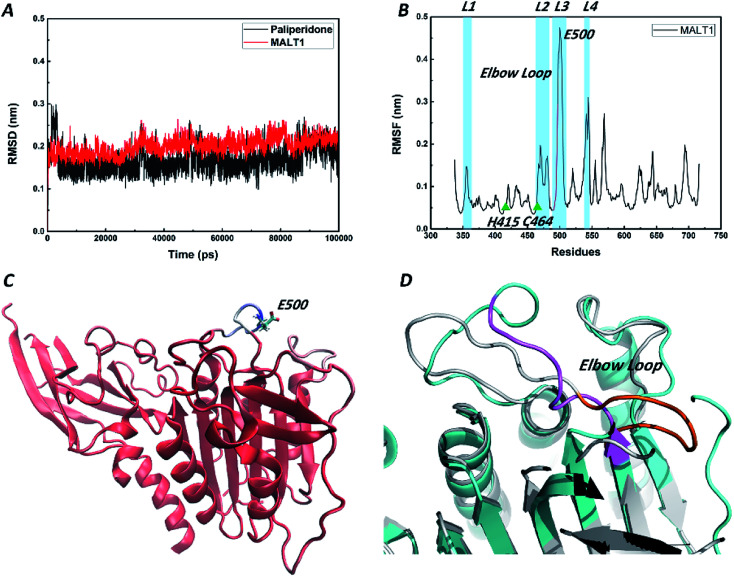
Fig. 6. Schematic drawing of the RMSD, RMSF, B-factor structure during the 100 ns MD simulations. (A) RMSD plots of MALT1 and paliperidone in 100 ns simulation. (B) RMSF plot of the residues of MALT1 in 100 ns simulation. The residues C464 and Q494 were shown as green triangle. The residues 491–498 in elbow loop were colored by pink. (C) Secondary structure of MALT1 was colored by B factors. Red represents a stable conformation, and blue represents a fluctuating conformation. Glu500 was shown by the stick model with cyan carbon skeleton. (D) Superposition of MALT1 in inactive state (cyan) and in active state (grey). The elbow loop of MALT1 was colored pink in inactive state and orange in active state.

Fig. 6