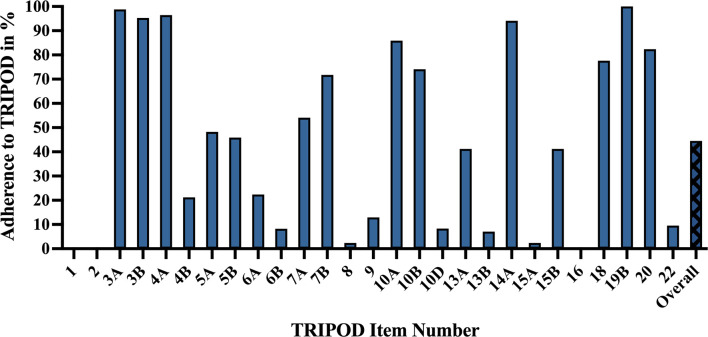
Figure 6.
TRIPOD adherence of machine learning glioma grade prediction studies. Adherence rate for individual items represents the percent of studies scoring a point for that item: 1 – title. 2 – abstract. 3a – background. 3b – objectives. 4a – study design. 4b – study dates. 5a – study setting. 5b – eligibility criteria. 6a – outcome assessment. 6b – blinding assessment of outcome. 7a – predictor assessment. 7b – blinding assessment of predictors. 8 – sample size justification. 9 – missing data. 10a – predictor handling. 10b – model type, model-building, and internal validation. 10d – model performance. 13a – participant flow and outcomes. 13b – participant demographics and missing data. 14a – model development (participants and outcomes). 15a – full model specification. 15b – using the model. 16 – model performance. 18 – study limitations. 19b – results interpretation. 20 – clinical use and research implications. 22 – funding. Overall – mean TRIPOD adherence rate of all studies. TRIPOD, Transparent Reporting of a multivariable prediction model for Individual Prognosis Or Diagnosis.

