. 2019 Dec 4;9(69):40268–40276. doi: 10.1039/c9ra07812f

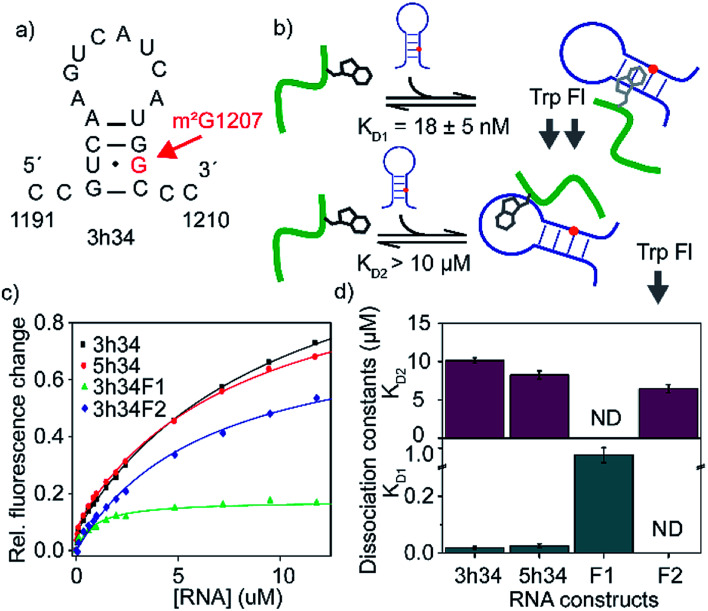
Fig. 3. (a) Predicted secondary structure of 3h34 model RNA is shown. (b) Schematic representation of RNA binding model of P1. The model assumes mutually exclusive binding of P1 close to either the methylation site or the hairpin loop. (c) The fraction of tryptophan fluorescence change is plotted against RNA concentrations used. Titration experiments are duplicated and results are averaged. (d) Equilibrium dissociation constants for various RNA–P1 complexes are obtained by least square fitting of titration curves to a modified binding isotherm equation. Top and bottom panels show KDs for lighter and tighter P1-RNA complexes, respectively. The 3h34F1 and 3h34F2 RNAs were fitted to the single binding isotherm.

Fig. 3