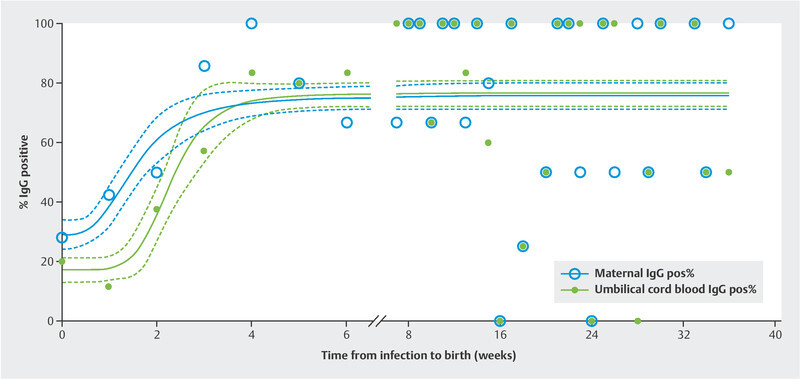
Fig. 1.

Regression lines, with 95% confidence intervals, for maternal (R 2 = 0.5813) and umbilical cord blood (R 2 = 0.7113) IgG seropositivity relative to the infection-to-birth interval (weeks). Blue circles indicate percentages (Y axis) of mothers, while green dots represent percentages of umbilical cord blood testing positive for anti-SARS-CoV-2 IgG for the indicated weeks between infection and birth (X axis). The regression lines differed significantly (comparison of fits: p < 0.0001, F = 8.958; dfn = 4, dfd = 340). Note the delayed response in seroconversion by one week between mothers and their offspring early after infection.
