. 2019 Dec 9;9(70):40781–40791. doi: 10.1039/c9ra06408g

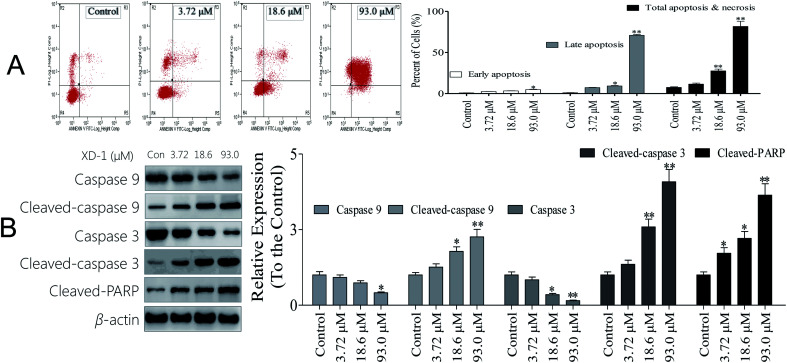
Fig. 1. XD-1 induces caspase-dependent apoptosis in HepG2 cells. Representative scatter diagrams. (A) Flow cytometric analysis of XD-1-induced apoptosis in HepG2 cells using Annexin V-FITC/PI staining. Cells in the lower right quadrant (Annexin V+/PI) represent early apoptotic cells, and those in the upper right quadrant (Annexin V+/PI+) represent late apoptotic cells. (B) XD-1 activates caspase cleavage. Equal amounts of whole-cell extracts were separated by 10% SDS-PAGE, electrotransferred onto PVDF membranes, and analyzed by western blotting. β-Actin was used as a loading control. The data are expressed as the mean ± SD of triple independent experiments. Compared with the control group, *p < 0.05, **p < 0.01. Blots were quantified using ImageJ software.

Fig. 1