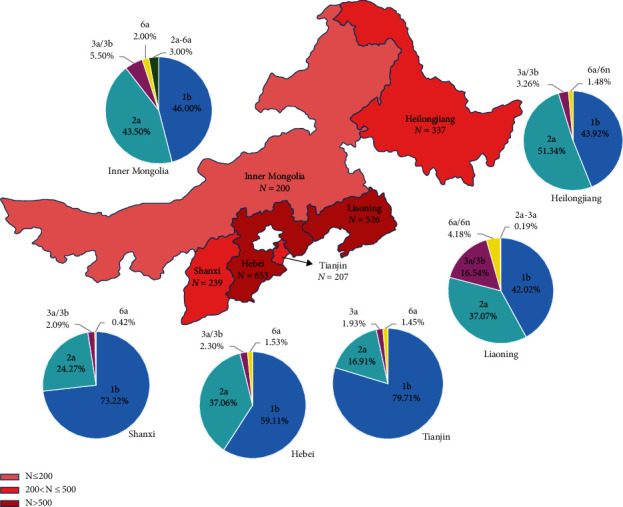
Figure 2.

Geographical distribution of HCV genotypes in different provinces/municipalities of North and Northeast China. The numbers of cases in different regions are shown in red on different scales. The numbers and proportions of different HCV genotypes in each region are presented by pie graphs with different colors.
