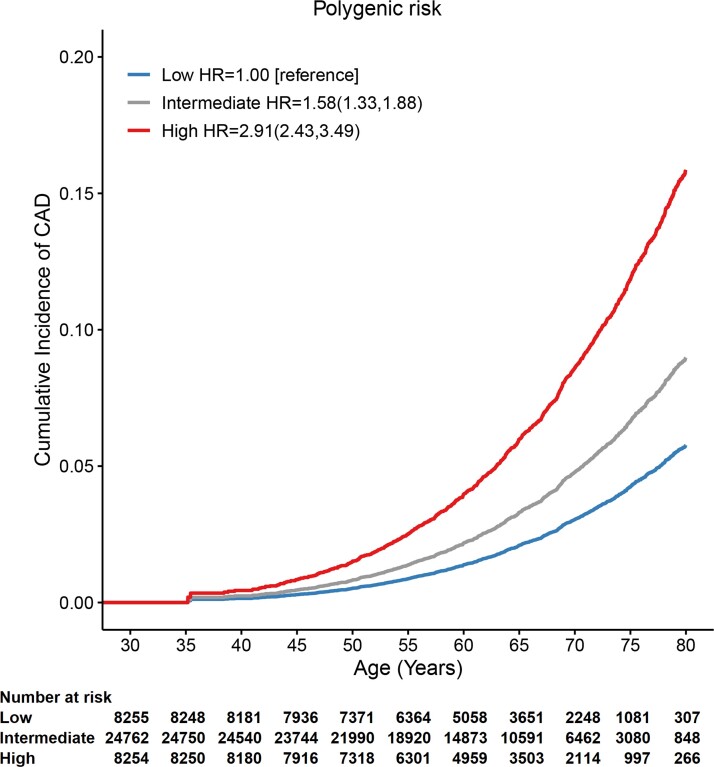
Figure 2.
Cumulative incidence curves for incident coronary artery disease across polygenic risk categories. Fine and Gray’s proportional hazards model accounting for competing risk was used to estimate the hazard ratios (95% confidence intervals) and the cumulative risk of coronary artery disease adjusted for sex and the first four principal components with age as the time scale. Polygenic risk categories: low (bottom quintile), intermediate (2nd–4th quintile), or high (top quintile) risk according to quintiles of the metaPRS. CAD, coronary artery disease; HR, hazard ratio; CI, confidence interval.

