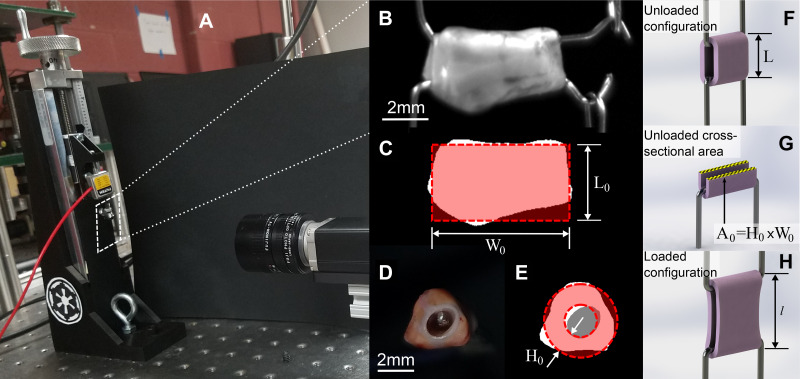
Figure 1.
Schematic of the geometric measurements relevant to the mechanical analysis. A: custom-made manually controlled uniaxial tensile testing machine. Images taken from the side (B) and from the arterial longitudinal axis (D) of a representative sample, as well as the same images after thresholding are represented in C and E, respectively. Also shown in C and E are schematic representations of how the sample’s initial width (W0) and thickness (H0) are estimated. Briefly, the width was defined as the widths of the rectangle fit to the side-view image of the sample (seen in C). The sample’s thickness was calculated as the difference in radii between the outer and inner effective circles—the outer effective circle was calculated by equating the areas of both the white and gray regions as shown in E and the inner effective circle was calculated by equating the area of the gray region only. F and H show schematics of the unloaded configuration’s length calculated at the end of the test (L, used to evaluate the stretch) as well as the loaded configuration’s length during the test (l). Finally, G highlights the cross-sectional area in the unloaded configuration A0 = H0 × W0.

