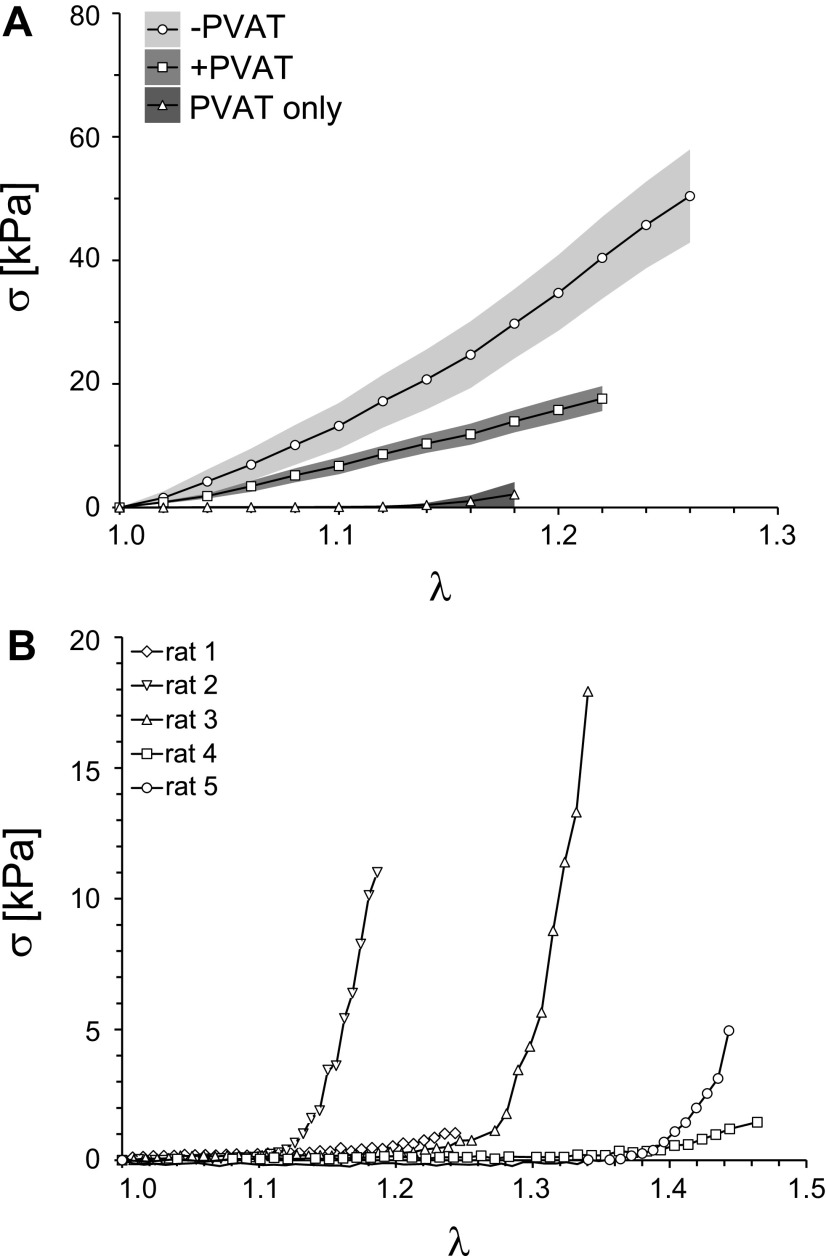
Figure 3.
Mechanical data for all groups. A: mean stress-stretch curves (lines) and SE of stresses (shaded regions) for −PVAT, +PVAT, and PVAT only data. For each group, N = 5 samples were tested. B: full mechanical data set collected for PVAT only samples. In A and B, Cauchy stress (σ) is represented on the y-axis and stretch (λ) is represented on the x-axis. PVAT, perivascular adipose tissue.

