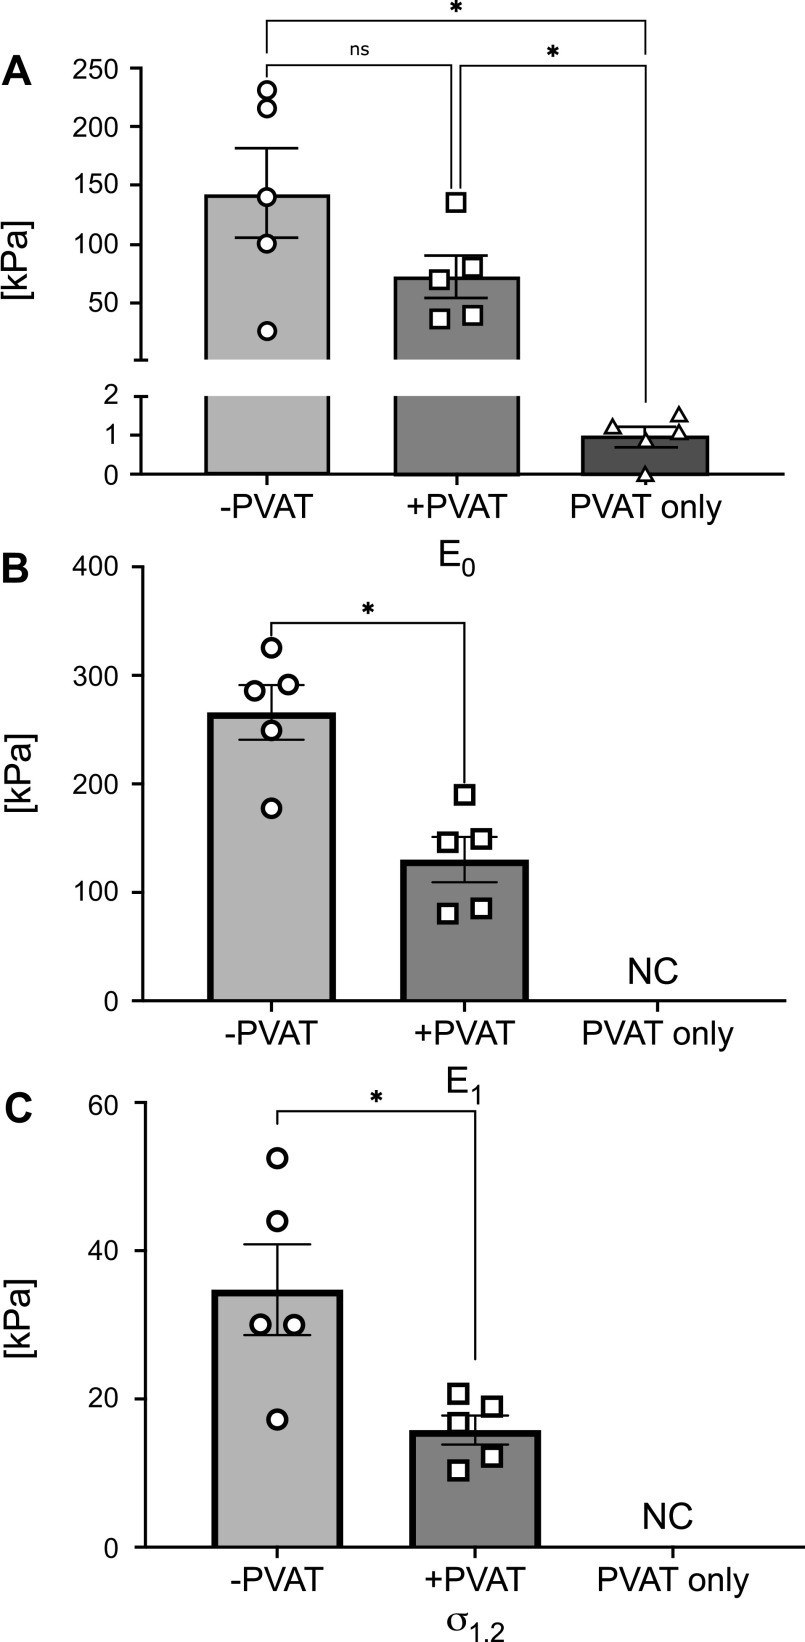
Figure 4.
Mechanical metrics quantified from experimental data, for all groups. Means ± SE of the low-stress stiffness (E0; A), the high-stress stiffness (E1; B), and stress at a stretch of 1.2 (σ1.2; C), represented for all groups tested. In B and C, the parameters for PVAT only could not be calculated (NC). For each group, N = 5 samples were tested. Statistical analysis for A: one-way ANOVA (−PVAT vs. +PVAT, P = 0.213; −PVAT vs. PVAT only, P = 0.042; +PVAT vs. PVAT only, P = 0.034). Statistical analysis for B and C: paired t test (−PVAT vs. +PVAT, P = 0.019 and P = 0.022, respectively). Significance is set at *P < 0.05. PVAT, perivascular adipose tissue.

