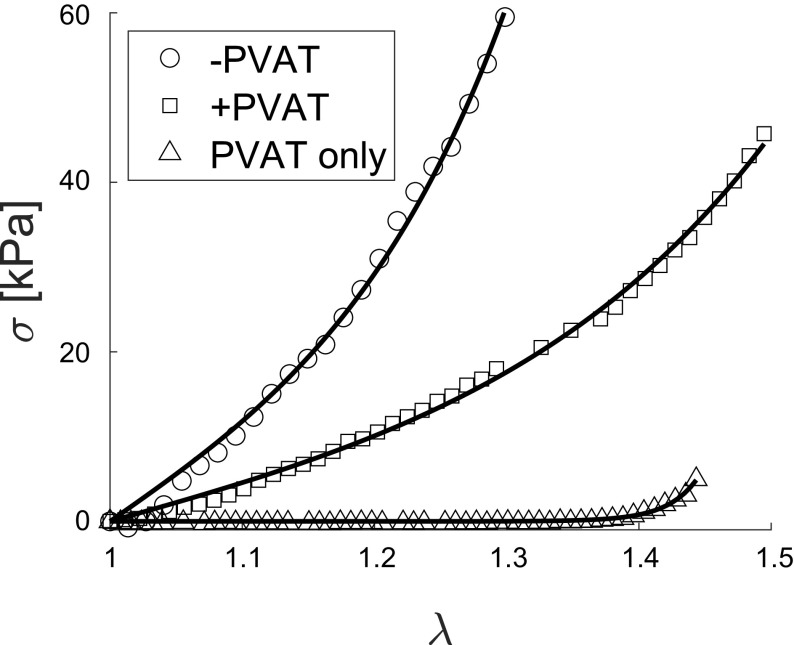
Figure 5.
Continuum mechanics model fit of experimental data. Stress-stretch data for −PVAT, +PVAT, and PVAT only, from a representative animal (symbols), along with the corresponding model fit (lines). Cauchy stress (σ) is represented on the y-axis and stretch (λ) is represented on the x-axis. Normalized root-mean-square error (NRMSE) is 0.030 for −PVAT, 0.040 for +PVAT, and 0.025 for PVAT only, when averaged between all samples. PVAT, perivascular adipose tissue.

