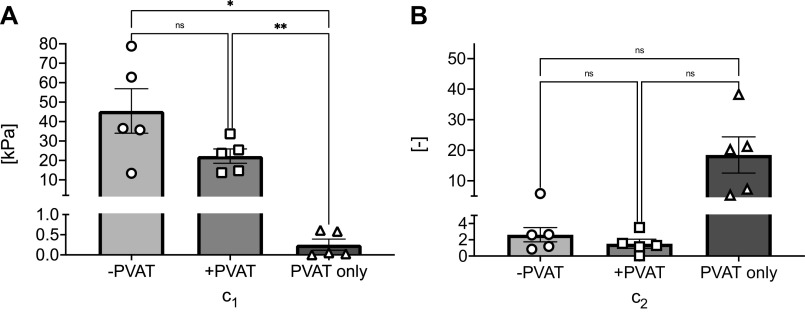
Figure 6.
Continuum mechanics model parameters. Means ± SE of model parameter estimates, c1 (A) and c2 (B). For each group, N = 5 samples were tested. Statistical analysis for A: one-way ANOVA (−PVAT vs. +PVAT, P = 0.145; −PVAT vs. PVAT only, P = 0.036; +PVAT vs. PVAT only, P = 0.009). Statistical analysis for B: one-way ANOVA (−PVAT vs. +PVAT, P = 0.528; −PVAT vs. PVAT only, P = 0.119; +PVAT vs. PVAT only, P = 0.100). Significance is set at *P < 0.05; **P < 0.01. ns, not significant; PVAT, perivascular adipose tissue.

