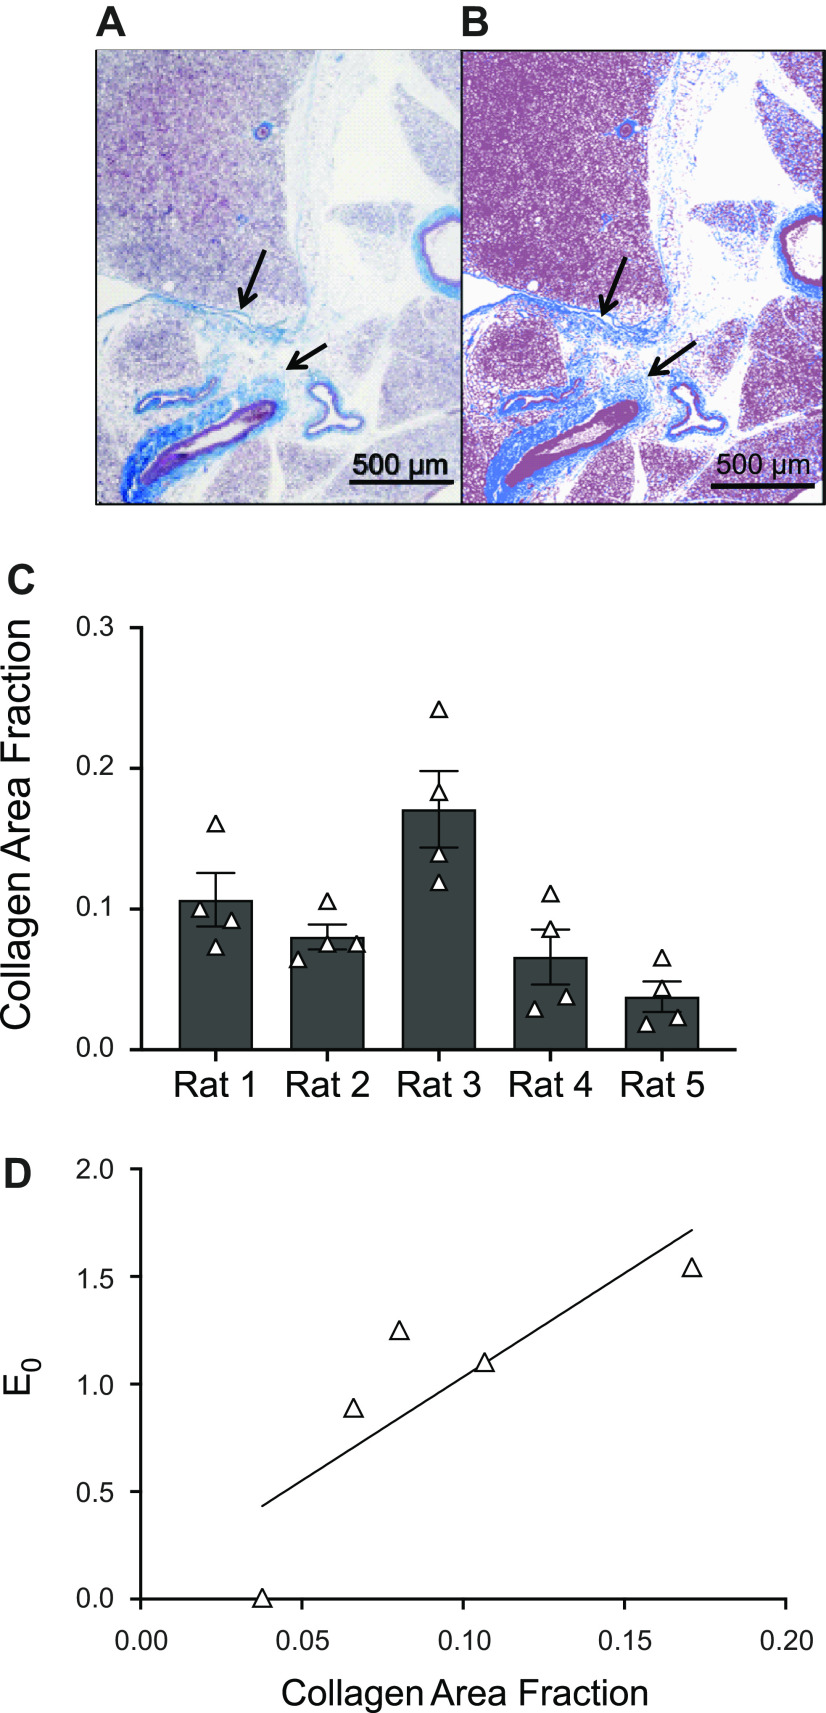
Figure 8.
Histological analysis of PVAT tissue. A and B: histological image of PVAT stained with Masson’s trichrome (magnification ×4). Image in A shows collagen in blue (highlighted by arrows in the figure), and cell nuclei and cytoplasm in red/purple. Image in B shows the segmented image after color thresholding, i.e., white background, blue collagen, and red/purple for everything else. Collagen area fraction is calculated as the ratio of blue pixels to nonwhite pixels in B. C: collagen area fraction estimated for all PVAT only samples, measurement for each animal (N = 5 animals) is represented as the means ± SE across n = 4 measures (i.e., number of locations on the histology). The means ± SE across animals is 0.092 ± 0.023. D: linear relation between collagen area fraction and low-stress stiffness (E0) for PVAT only samples (Pearson coefficient r = 0.84, N = 5). PVAT, perivascular adipose tissue.

