. 2019 Dec 16;9(71):41419–41430. doi: 10.1039/c9ra07071k

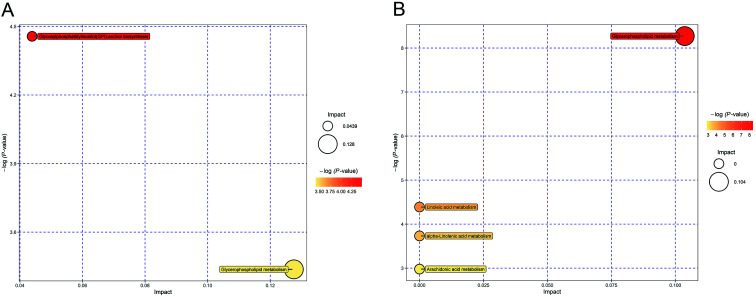
Fig. 6. Pathway analysis for identified metabolites. All matched pathways are plotted according to P-value from pathway enrichment analysis and pathway impact score from pathway topology analysis. Each bubble in the bubble diagram represents a metabolic pathway. The horizontal axis and bubble size represent impact score from pathway topology analysis (the larger the circle the higher the impact score); the vertical coordinate where the bubble is and the bubble color indicate the P value (take the negative natural log, i.e. −log P-value) of the enrichment analysis (the darker the bubble the lower P-value). (A) Pathway analysis of the 32 identified metabolites at EIC−. (a) Glycosylphosphatidylinositol (GPI)-anchor biosynthesis; (b) glycerophospholipid metabolism (B) pathway analysis of the 26 identified metabolites at EIC+. (a) Glycerophospholipid metabolism; (b) linoleic acid metabolism; (c) alpha-linolenic acid metabolism; (d) arachidonic acid metabolism.

Fig. 6