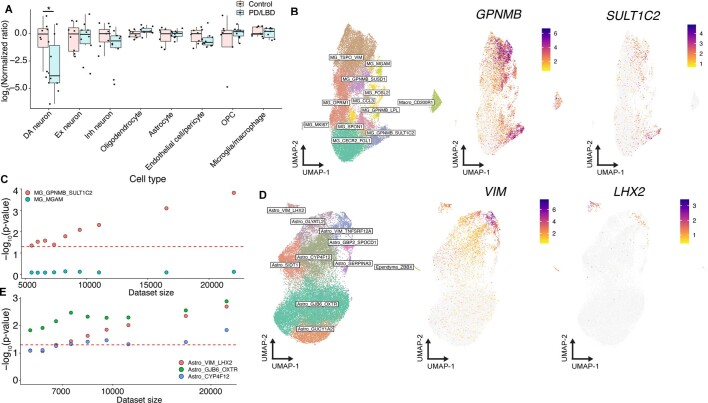
Extended Data Fig. 8. Analyses and robustness testing of cell type proportional changes in PD/LBD.
a, Box plot of log2 ratio of cell types normalized to median of control ratios. Pink and blue dots denote control and PD/LBD individuals, respectively (* = p < 0.05, p = 0.034, Wilcoxon rank-sum two-sided test, n = 8 neurotypical controls and 10 PD/LBD postmortem samples). Center bar indicates median value and lower and upper hinges correspond to first and third quartiles respectively. Whisker distance from upper and lower hinges represent no more than 1.5*interquartile range. b, Left = UMAP of 33,041 microglia/macrophage cells. Middle and right = expression of GPNMB and SULT1C2 marking specific expression in the annotated microglia cluster. c, Dot plot of downsampling analysis for two microglia subtypes. Red dotted line is FDR-adjusted p-value = 0.05. d, Left = UMAP of 33,506 astrocytes. Middle and right = expression of VIM and LHX2 respectively marking specific expression in the annotated astrocyte cluster. e, Dot plot of downsampling analysis for three astrocyte subtypes. Red dotted line is FDR-adjusted p-value = 0.05.

