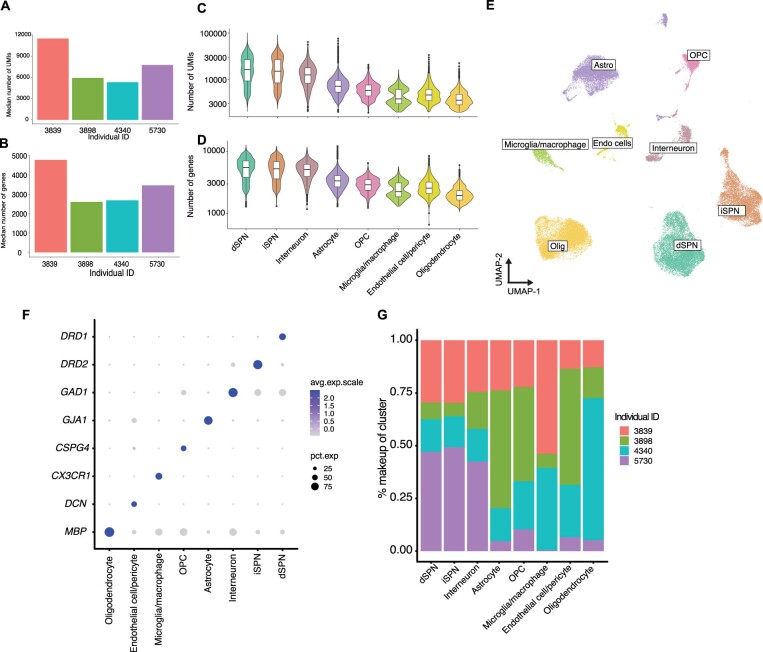
Extended Data Fig. 9. Analysis of human dorsal striatum by snRNA-seq.
a,b, Median number of UMIs (A) and genes (B) per donor. c,d Violin plots showing the number of UMIs (C) and (D) across eight major cell classes defined by clustering. (n = 9,096 iSPNs; 10,503 dSPNs; 8,433 astrocytes; 1,418 endothelial cells/fibroblasts; 2,115 inhibitory neurons; 2,105 microglia/macrophages; 2,445 OPCs; 10,667 oligodendrocytes), direct spiny projection neurons; iSPN, indirect spiny projection neuron; OPC, oligodendrocyte precursor cells. For box plots in (C) and (D), center bars indicates median value and lower and upper hinges correspond to first and third quartiles respectively. Whisker distance from upper and lower hinges represent no more than 1.5*interquartile range. e, UMAP representation of 46,872 single nuclei from the dorsal striatum colored by major cell class. Astro, astrocyte; Olig, oligodendrocyte; Endo cells, endothelial cell/pericyte. f, Dot plot showing specific expression of selected marker genes across the eight major cell classes. g, Percent contribution of four tissue donors to the eight major cell classes.

