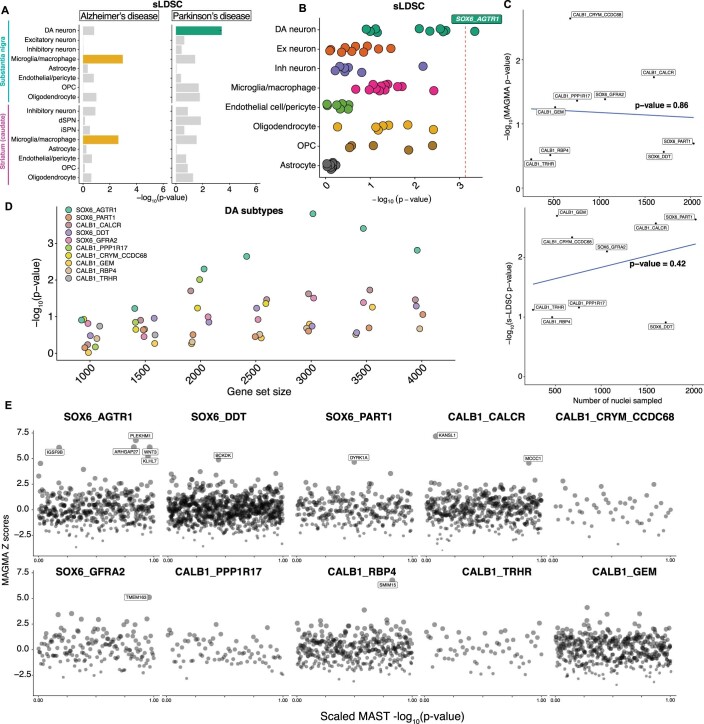
Extended Data Fig. 10. Genetic enrichment analyses of the substantia nigra cell types and subtypes.
a, Bar plot of -log10-transformed p-values from s-LDSC (stratified LD score) enrichment of Alzheimer’s (left) and Parkinson’s disease (right) across 16 cell types from dorsal striatum (caudate) and SNpc. Bars are colored for significantly (Bonferroni-corrected p-value < 0.05) enriched cell types. b, Dot plot of -log10-transformed p-values for s-LDSC analysis of PD genetic risk in the 68 transcriptionally defined SNpc clusters. Clusters are grouped on the y-axis by major cell class. Red dotted line indicates the Bonferroni significance threshold (p-adjusted < 0.05). c, Scatter plot of number of nuclei sampled per DA subtype (x-axis) and -log10-transformed p-values from MAGMA (top) and s-LDSC (bottom) analyses. Blue line indicates the line of best fit as determined by lm.fit package (Methods). P-value determined from a two-sided significance testing of the slope coefficient from the best fit line (n = 9 DA subtypes, see Methods). d, Dot plot of -log10-transformed p-values for MAGMA analysis of DA subtype markers across gene set sizes (Methods) for PD common variant study(38). e, Pseudo-Manhattan of genes specific to each DA subtype (Extended Data Fig. 2c) ordered by scaled -log10-transformed p-values from MAST (Methods). Genes are those prioritized by MAST (Z-score > 4.568).

