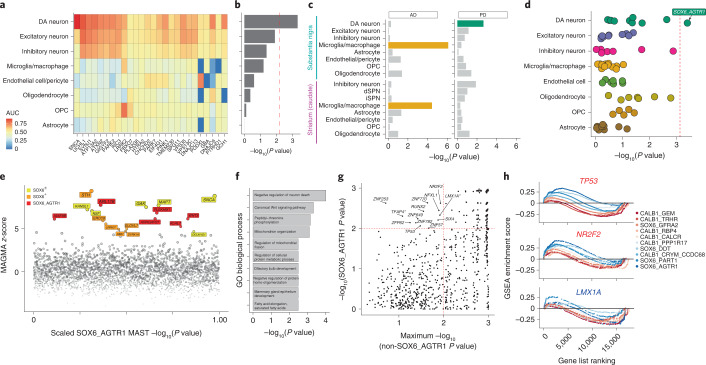
Fig. 4. Genetic enrichments and TF set analyses within DA subtypes.
a, Heatmap of expression of 26 familial genes, colored by AUC statistic (Presto; Methods). b, Bar plot of −log10-transformed P values from Fisher’s exact test comparing overlap between markers for major cell types (Methods) and familial variant genes. Red dashed line indicates Bonferroni significance threshold (P < 0.05) c, Bar plot of −log10-transformed P values from MAGMA enrichment of AD (left) and PD (right) across 16 cell types from dorsal striatum (caudate) and SNpc. Bars are colored for significantly (Bonferroni-corrected P < 0.05) enriched cell types. d, Dot plot of −log10-transformed P values for MAGMA analysis of PD genetic risk in 68 transcriptionally defined SNpc clusters. Clusters are grouped on the y axis by major cell class. Red dashed line indicates Bonferroni significance threshold (P < 0.05). e, Scatter plot of genes nominated from MAGMA gene-based analysis (y axis) and enriched in the SOX6_AGTR1 set (x axis). Red indicates genes not differentially expressed in any other DA subtype; orange indicates genes enriched within all SOX6+ DA subtypes; yellow indicates genes enriched in SOX6+ or SOX6– DA subtype. #, Loci that have the nominated SNP within a coding region of the nominated gene. f, GO terms enriched among genes differentially expressed within the SOX6+ subtype that also have high (z-score > 4.568) MAGMA z-scores derived from PD GWA study. g, GSEA of TF target sets (Methods) within the SOX6_AGTR1 type (y axis) versus the maximum value of any other DA type (x axis). Dashed red lines indicate FDR-significant TFs. *, TFs with a negative enrichment score. h, GSEA trace plots for three TFs: TP53, NR2F2 and LMX1A. Colors correspond to ORs derived from MASC analysis (Fig. 2b). dSPN, direct spiny projection neuron; iSPN, indirect spiny projection neuron.

