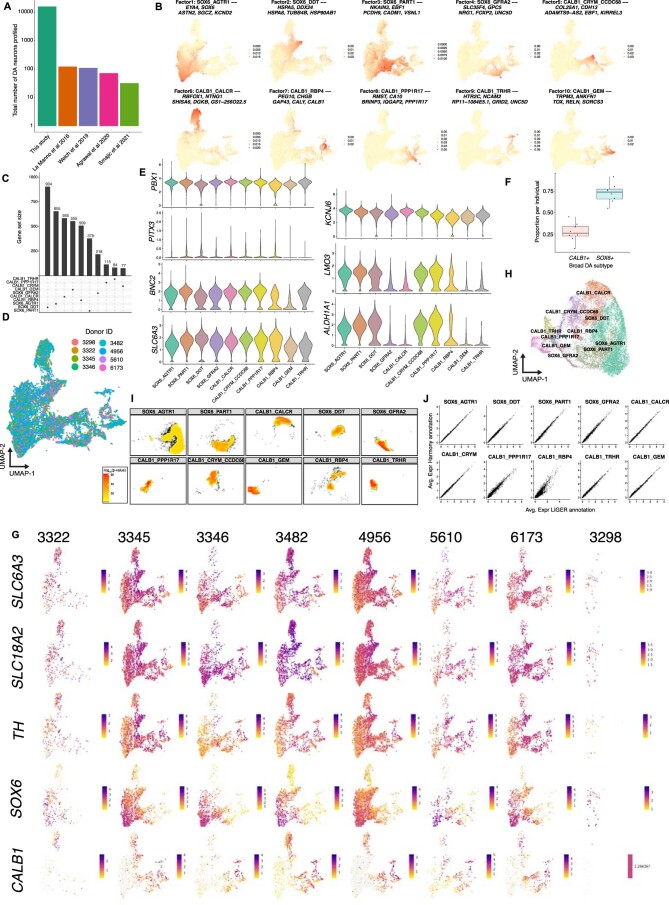
Extended Data Fig. 2. High-throughput profiling and characterization of human midbrain DA neuron diversity.
a, Bar plot (log scale) of total number of midbrain DA neurons profiled in this study and all previous single-cell studies of the human midbrain. b, Factor loadings obtained from LIGER integrative analysis projected onto UMAP embedding of DA neuron analysis. Title of each plot indicates highest loading DA subtype and top five highest loading genes (see Methods) for each factor. c, Upset plot of gene sets specific to each DA subtype determined by MAST differential expression analysis (Methods) d, SNpc UMAP representation of 15,684 DA profiles colored by individual. e, Violin plots showing scaled expression of genes previously defined by La Manno et al. as specific to midbrain DA neurons (left) and specific to subtypes identified in the mouse brain (right) f, Box plot of proportion of SOX6 + and CALB1 + DA neurons per individual (n = 8 neurotypical controls). Center bar indicates median value and lower and upper hinges correspond to first and third quartiles respectively. Whisker distance from upper and lower hinges represent ≤1.5× IQR. g, Expression of (in descending order) SLC6A3, SLC18A2, TH, SOX6, and CALB1 per individual. h, UMAP embedding of DA neurons colored by annotations determined via Harmony (see Methods). i, Density plots depicting -log10-transformed p-values of a resampling test (see Methods) to determine concordance of LIGER annotations in the Harmony-derived UMAP embedding. j, Scatter plot depicting average expression per DA subtype for the LIGER-derived annotations (X-axis, Fig. 1d) and Harmony-derived annotations (Y-axis, Extended Data Fig. 2h).

