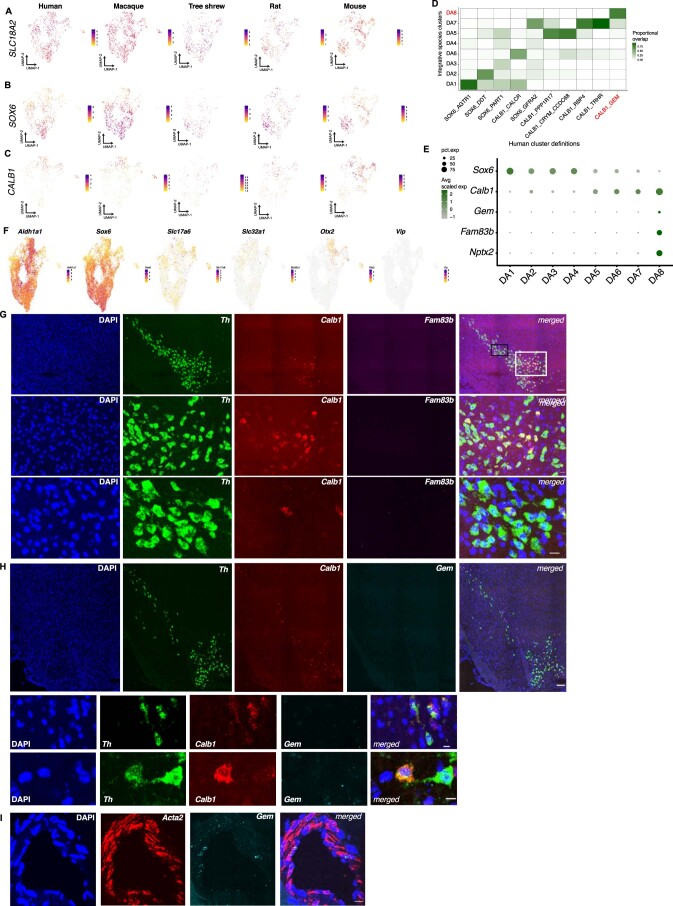
Extended Data Fig. 3. Cross-species analysis of DA subtypes.
a–c, Expression of SLC18A2 (DA neuron marker) (A), SOX6 (B), and CALB1 (C) across all five species sampled. d, Confusion matrix showing overlap of human cells within clusters defined by the cross-species integrative analysis and the human-only analysis (Fig. 1d). The clusters colored in red correspond to the primate-specific population (DA8) and cognate population in the human-only analysis (CALB1_GEM). e, Dot plot of additional marker genes for the primate-specific population, DA8. f, Feature plots of genes defined by Poulin et al as specific to subtypes of DA neurons in the mouse midbrain. g, Single-molecule fluorescence in situ hybridization (smFISH) images depicting absence of Fam83b + mouse nigral DA neurons. Top row = scanned and tiled image. Middle = white inset from top row indicating midline DA neurons. Bottom row = black inset from top row showing high-resolution images of mouse pars compacta dorsal tier. Th (green), Calb1 (red), and Fam83b. Top row scale bar = 100 microns. Middle/bottom row scale bar = 10 microns. h, Single-molecule FISH images depicting absence of Gem + mouse nigral DA neurons. Top = scanned and tiled view of in situ hybridization stains of mouse midbrain. Middle and bottom rows indicate high resolution example images of Th + /Calb1 + /Gem- cells in the dorsal tier (middle) and midline A9 region (bottom). Top row scale bar = 100um. Middle/bottom row scale bar = 10 microns. i, High-resolution view of in situ hybridization stains of Acta2 and Gem showing detection of Gem in smooth muscle vasculature but not DA neurons. Scale bar = 20 microns. Experiment was repeated twice for Fam83b and Gem in situ analyses and once for the Acta2 co-localization in mural cells.

