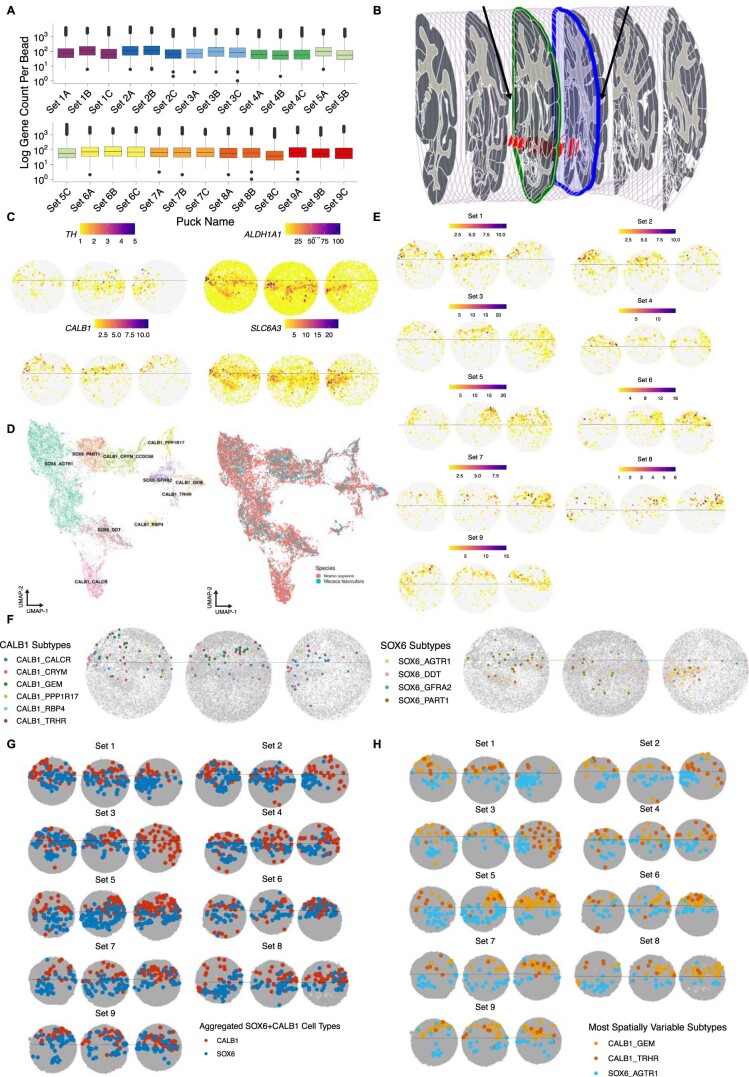
Extended Data Fig. 5. Slide-seq mapping of DA neurons.
a, Box plots showing, for each bead array, the log number of genes captured per bead (n = 27 bead arrays). Each bead array is a part of a triplet set serially created during the dissection (Methods). Center bar indicates median number of genes and lower and upper hinges correspond to first and third quartiles of data, respectively. Whisker distance from upper and lower hinges represent no more than 1.5*interquartile range. b, Anatomical plates of Macaca fascicularis brain (71) in sagittal view with coronal sectioning. Highlighted red region is the substantia nigra. Black arrows indicate approximate locations of start (green highlighted plate) and end (blue highlighted plate) of sets of bead arrays sampled via Slide-seq. c, Spatial plot for the pucks in Set 1 showing each bead’s expression of TH, ALDH1A1, CALB1, and SLC6A3. d, UMAP showing integrative analysis (Methods) of control DA neuron snRNA-seq profiles and Macaca fascicularis DA neuron snRNA-seq profiles. Left — colored by DA types defined by the human integrative analysis (Fig. 1d). Right — colored by species. e, Expression of CALB1 across all 27 bead arrays showing putative location of the substantia nigra pars compacta dorsal tier. f, Bead arrays showing localization of all 10 DA subtypes from Set 1 (Fig. 2b-d) as determined by RCTD (Methods). g, Location of aggregated SOX6 + and CALB1 + subtypes across all 27 bead arrays. h, Location of three highly spatially variable subtypes (SOX6_AGTR1, CALB1_TRHR, CALB1_GEM) across all 27 bead arrays.

