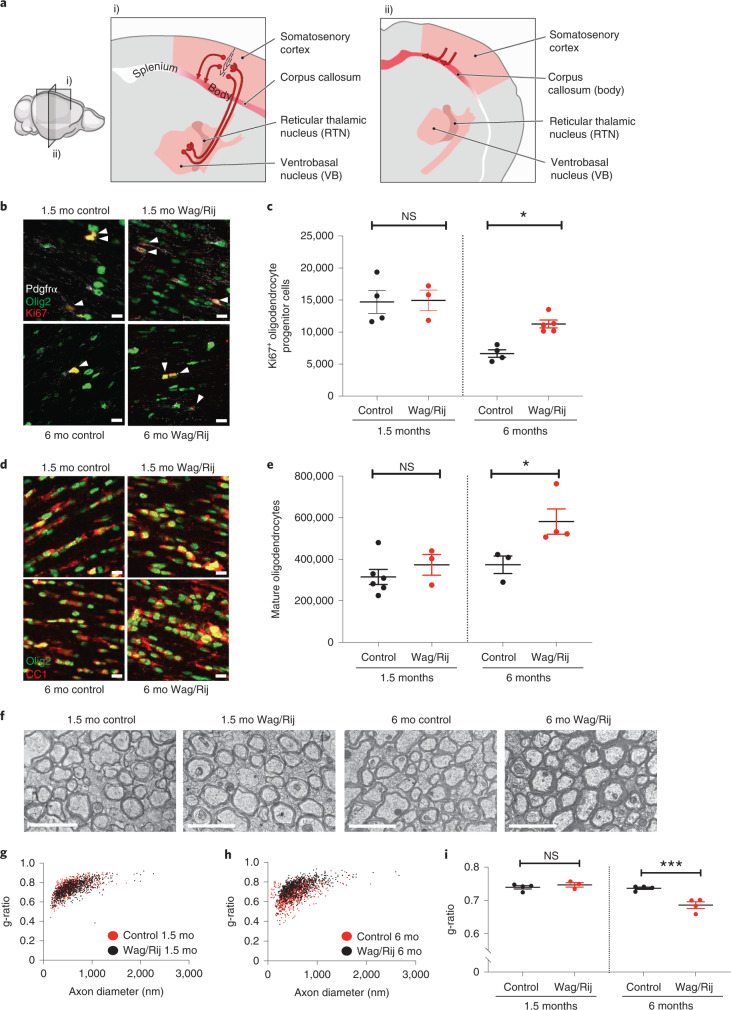
Fig. 1. Increased oligodendrogenesis and myelination within the absence seizure network after epilepsy onset in Wag/Rij rats.
a, Sagittal (i) and coronal (ii) views of the absence seizure network (pink/red). Absence seizures are maximal in ventrobasal and reticular thalamic nuclei and somatosensory cortices and propagate across the corpus callosum body, with little involvement of occipital cortices and corpus callosum splenium. Illustration by Sigrid Knemeyer at SciStories. b, Representative photomicrographs of dividing callosal OPCs expressing Olig2 (green), PDGFRα (white) and Ki67 (red), indicated with arrowheads. Scale bars, 10 μm. c, Total Ki67+ OPCs at 1.5 months and 6 months in control and Wag/Rij rats. 1.5 months, n = 4 control and 3 Wag/Rij rats; 6 months, n = 4 control and 5 Wag/Rij rats. One-way ANOVA: F3,12 = 10.43, P = 0.0012. Post hoc Sidak’s test comparing Ki67+ OPCs in Wag/Rij versus controls at 6 months: P = 0.025, and at 1.5 months: P = 0.99. d, Representative photomicrographs of callosal mature oligodendrocytes of 1.5-month-old and 6-month-old control or Wag/Rij rats, co-expressing Olig2 (green) and CC1 (red). Scale bars, 10 μm. e, Total callosal oligodendrocytes in control and Wag/Rij rats. 1.5 months, n = 6 control and 3 Wag/Rij rats; 6 months, n = 3 control and 4 Wag/Rij rats. One-way ANOVA: F3,12 = 6.558, P = 0.0071. Post hoc Sidak’s test comparing oligodendrocyte quantity in 6-month-old Wag/Rij rats versus controls: P = 0.029; 1.5-month-old: P = 0.65. f, Representative transmission electron micrographs of axon cross-sections in the mid-sagittal corpus callosum body. Scale bar, 2 μm. Scatter plots of individual axon g-ratios from 1.5-month-old (g) and 6-month-old (h) rats; each dot represents the g-ratio of one axon. i, Mean g-ratios for each rat; 1.5 months: n = 4 control and 3 Wag/Rij rats; 6 months: n = 4 control and 4 Wag/Rij rats. One-way ANOVA, F3,11 = 17.09, P = 0.0002. Post hoc Sidak’s test, control versus Wag/Rij at 1.5 months, P = 0.72, and 6 months, P = 0.0004. Each dot represents one rat (c, e, i); data are shown with group mean ± s.e.m. Black dots, control; red dots, Wag/Rij. *P < 0.05, **P < 0.01, ***P < 0.001, NS, non-significant (P > 0.05).

