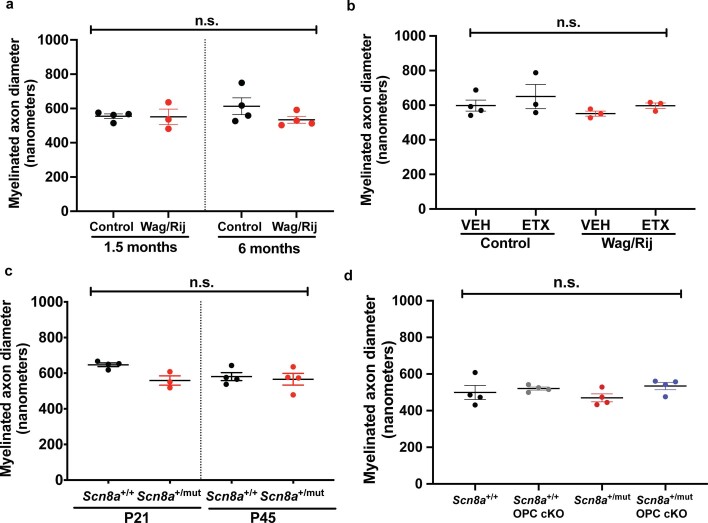
Extended Data Fig. 2. Myelinated axon diameters do not contribute to g-ratio differences in Wag/Rij rats and Scn8a+/mut mice.
(a) Mean diameters of myelinated axons for each rat. 1.5-month timepoint, n=4 control (black dots), 3 Wag/Rij (red dots); 6-month timepoint, n=4 control, 4 Wag/Rij rats. One-way ANOVA: F(3,11)=1.065, p=0.4033. (b) Myelinated axon diameter in the body of the corpus callosum at 7-months of age in control (black dots) and Wag/Rij (red dots) rats treated with vehicle (VEH) or ethosuximide (ETX). (Control-VEH, n=4 rats; Control-ETX, n=3 rats; Wag/Rij-VEH, n=3 rats; Wag/Rij-ETX, n=3 rats). One-way ANOVA: F(3,9)=0.9890, p=0.44. (c) Mean myelinated axon diameters for Scn8a+/+ (black dots) and Scn8a+/mut (red dots) mice. P21, Scn8a+/+ n=4 mice; Scn8a+/mut n=3 mice. P45, Scn8a+/+ n=4 mice; Scn8a+/mut n=4 mice. One-way ANOVA: F(3,11)=2.822, p=0.088. (d) Myelinated axon diameters in the body of the corpus callosum in 6-month-old Scn8a+/+ (black dots, n=4 mice), Scn8a+/+ OPC cKO (gray dots, n=4 mice), Scn8a+/mut (red dots, n=4 mice) and Scn8a+/mut OPC cKO mice (blue dots, n =4 mice). One-way ANOVA: F(3,12) =1.324, p=0.31. Each dot represents the mean for one rat or mouse, shown with group means ± SEM. *p<0.05, **p<0.01, ***p<0.001, n.s.=nonsignificant (p>0.05).

