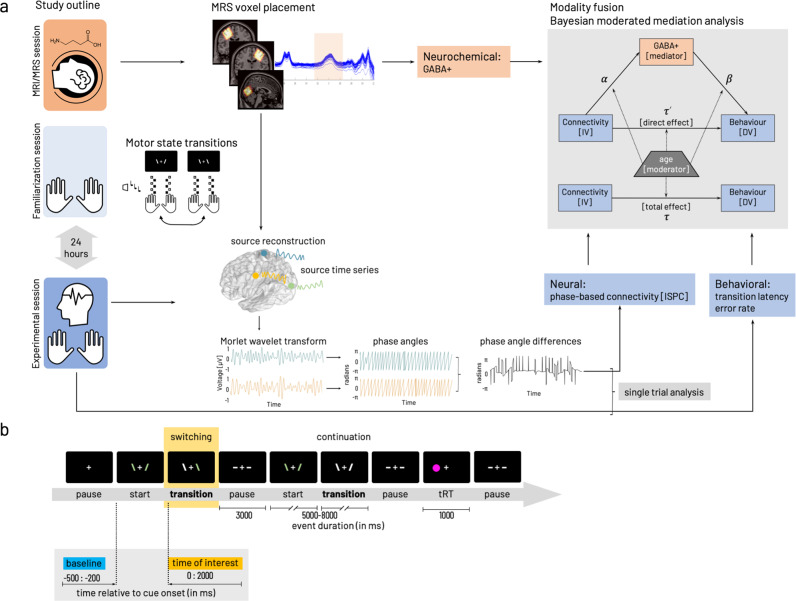
Fig. 1. Experimental procedures and parameters of interest.
a Study outline with MRI/MRS (session 1), task familiarization (session 2) preceding the main experiment (session 3) including EEG during task performance. Edited MRS and T1-weighted images were used to extract tissue-corrected GABA levels and additional macromolecules (GABA+) from left and right sensorimotor and occipital voxels. The behavioral paradigm involved transitions between a stable (mirror-symmetric in-phase tapping of both index or middle fingers synchronously) and a less stable (anti-phase tapping, i.e., contralateral index and middle finger synchronously) motor state. Task familiarization included stimulus-response mapping and individual performance frequency adjustment. Performance in motor-state transitions was described with transition latency and error rate. The EEG signal was projected into source space based on the centroid coordinates of the GABA voxels. Phase angles were computed based on spectrally decomposed (Morlet wavelet transform) source time series. Phase angle differences between source signal pairs were used to compute connectivity (inter-site phase clustering, ISPC) between cortical sources. Phase angle differences were associated with behavioral performance in a single trial-based analysis. Then parameters of interest from the individual modalities (neurochemical, neural, behavioral) were integrated with a Bayesian moderated mediation analysis estimated for interhemispheric motor-cortical connectivity as independent variable [IV]. In both cases, dependent variable [DV] behavior was either median transition latency or cumulative error rate. Details on formalization of model paths given in “Methods”. b Flow of events within the behavioral paradigm. Periods of finger movement (start, continuation, switching) were interleaved with rest periods (pause). A randomly occurring thumb reaction time task, a fast key press with either left or right thumb in response to appearance of a circle on the side of the required response was interspersed with the other events with a 5% probability of occurrence. Inlay highlights the time zones relevant for the analysis of behavioral data and EEG/EMG data analysis (time of interest, yellow). Data collected in the within-trial pause (demarked in blue) was used as baseline for the EEG/EMG analysis of the data from the time of interest (yellow). All parts of this figure have been created and published by the corresponding author on https://doi.org/10.6084/m9.figshare.19609842 licensed under CC BY 4.0.

