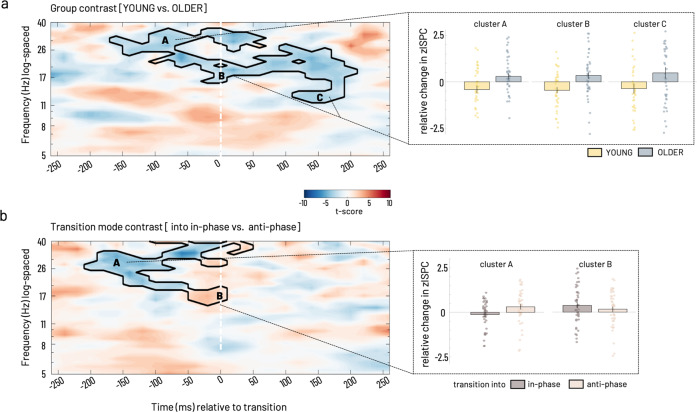
Fig. 4. Statistical results of ISPC between left and right S/M1 source.
a For group contrast time-locked to the individual mean transition time. Cluster-corrected z maps for the test of GROUP contrast [YOUNG–OLDER, t-test against 0, p < 0.05, 2-tailed]. Color coding in the time-frequency resolved zISPC plot indicates t-values. Dashed vertical lines at 0 ms on the time axis indicate the individual median latency, i.e., the time of transition. b Statistical results for transition mode contrast time-locked to the individual mean transition time. Inlays show bar plots, which represent group averages (±SEM) of zISPC for respective cluster ranges indicated by capital letters for (a) group and (b) transition mode contrasts. Scatter plots depict individual participants’ data for the group (yellow—young, blue—older) and transition mode (brown—in-phase, light rosé—anti-phase), respectively. Cluster-corrected z maps for the test of TRANSITION MODE contrasts [into in-phase–into anti-phase, t-test against 0, p < 0.05 2-tailed]. Bar plots show transition mode averages (±SEM) for respective cluster ranges. Phase-related connectivity (ISPC) data was analyzed in N = 22 older and N = 20 young participants.

