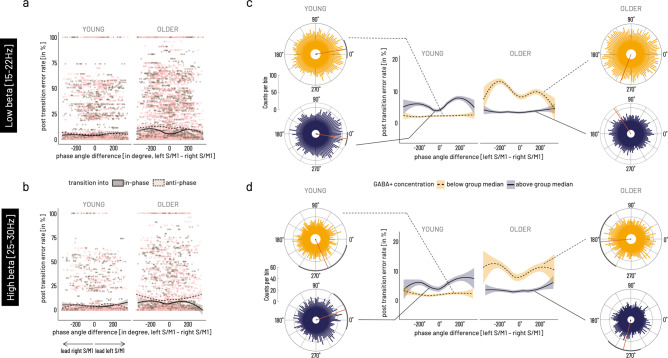
Fig. 5. Association between cortico-cortical phase angle differences at the time of transition and subsequent performance error.
a Single-trial data shown for low beta [15–22 Hz] range. b Single-trial data shown for high beta range [25–30 Hz]. Data points represent single-trial data for transitions into in-phase (brown) and into anti-phase (light pink) mode, solid line indicates average phase angle difference—behavior association during transitions into in-phase mode, dashed line indicates average phase angle difference—behavior association for transitions into anti-phase mode. c Mean phase angle differences in the low beta frequency band were significantly modulated by factors age group and relatively higher versus lower GABA+ concentration when binarized into above group median (dark purple, solid lines represents subsample mean) versus below group median (yellow shading, dashed lines for subsample mean). d Mean phase angle differences in the high beta frequency band show a comparable pattern as in the low beta band. Rose plots show the histogram of binned phase angle differences with mean direction (red line) and 95% CI (black circumference) for significant non-uniformity of distribution. Phase angle differences for the low and high beta band were significantly associated with subsequent performance error in the young with relatively higher and in the older with relatively lower motor-cortical GABA+ concentration. In these subgroups, close to 0˚ phase lag was behaviorally beneficial (lower errors), while close to 180˚ phase lag was associated with higher performance errors. The analysis of single-trial phase-angle differences and performance error included data from N = 22 older and N = 20 young participants.

