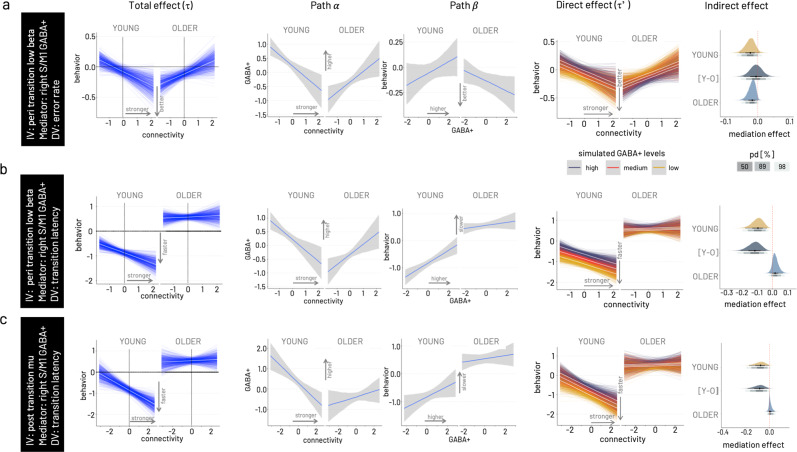
Fig. 7. Results of Bayesian moderated mediation models.
From left to right, total effect (pathτ) conditional on moderator age, association between connectivity and GABA+ (path α), association between GABA+ and transition latency (path β), simulation of the mediation effect on the connectivity—behavior association (direct effect, path τ’) for varying levels of GABA+ (low—yellow, medium—red, high—dark purple), and probability density ploy for the mediation effect conditional on age including the difference of young versus older [Y-O] mediation effects. In all three models, right hemispheric GABA+ concentration is modeled as mediator. a Model for peri-transition low beta connectivity—error rate association. As visible in the total effect, the young behaviorally benefit from stronger S/M1-S/M1 connectivity in the low beta range, while the older show higher errors with stronger connectivity. The association between connectivity and GABA+ (path α) shows opposing trends in the two age groups, a negative association in the young and a positive association in the older. The association between GABA+ and transition latency (path β) is positive in the young and negative in the older. Simulations for the full moderated mediation model show that for the young the positive behavioral effect of stronger connectivity is more pronounced in the presence of relatively lower GABA+, while for the older the negative effect of increased connectivity is ameliorated in the presence of higher GABA+. Probability density plots of the mediation effect conditional on age for this model show a negative indirect effect for both age groups, and no difference between the age groups. Gray shading of probability of direction (pd) indicates limits of 50, 89, and 98% CI. b Model for peri-transition low beta connectivity— transition latency association. c Model for post-transition high mu connectivity—transition latency association. The Bayesian moderated mediation analysis was run based on data from N = 22 older and N = 20 younger participants.

