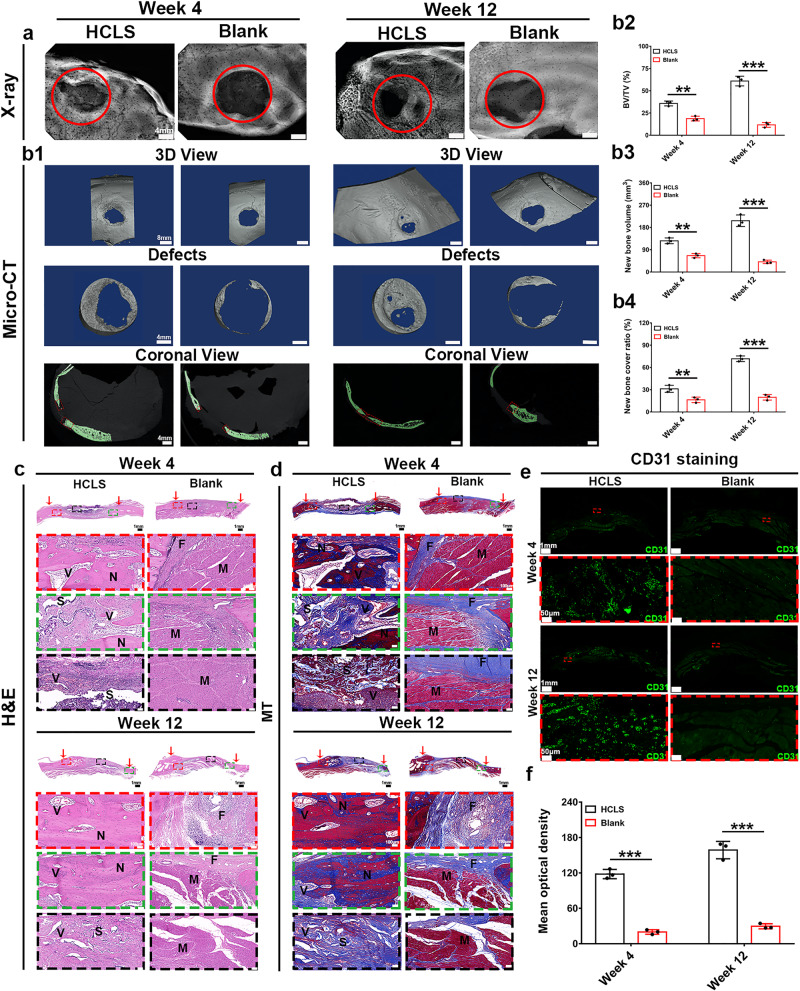
Fig. 9. Skull reconstruction by HCLS activating angiogenesis and osteogenesis in beagle dog model.
a X-ray images of the regenerated bone tissue. b1 Representative micro-CT images and b2–4 quantitative histomorphometry analyses of bone regeneration in cranial defects in dogs at 4 and 12 weeks (b2: **p = 0.0074, ***p = 1.5931 × 10⁻⁷; b3: **p = 0.0008; ***p = 5.4303 × 10⁻⁷; b4: **p = 0.0019, ***p = 2.51131 × 10⁻⁷). n = 3 biologically independent replicates. c H&E staining of regenerated bones at 4 and 12 weeks after operation. d Masson’s trichrome staining of regenerated bones at 4 and 12 weeks after the operation. (Row 1: overall observation of the cranial defect repair. The red arrow indicates the initial boundary of the defect. Row 2: magnified view of the center and boundary site of the defect). (N: new bone tissue. S: scaffolds. V: new blood vessels. F: fibrous tissue. M: Muscle tissue). e Representative IF staining images of CD31 at 4 and 12 weeks after implantation. f Semiquantitative analysis of CD31 IF staining at 4 and 12 weeks. (all scaffolds without cells. Blank: defect alone with no treatment) (***p = 8.1804 × 10⁻⁷, ***p = 9.7494 × 10⁻⁸). (two-sided comparison, error bars represent standard deviation, *p < 0.05, **p < 0.01, and ***p < 0.001).

