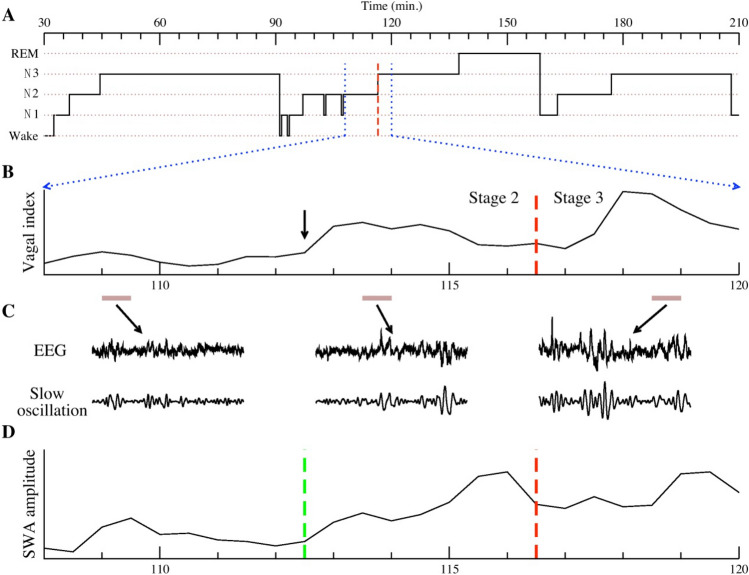
Figure 3.
(A) Conventional AASM sleep stage annotation for a 3-h sleep period. We focus on the 12-min sub-period enclosed by the two vertical dotted blue lines (from 108 to 120 min) that contains both stages N2 and N3. A dashed red vertical line indicates the transition from N2 to N3. (B) A heart rate derived cardiac vagal tone indicator, as measured by the ratio of high- to low-frequency heart rate variability, is plotted for this period. Of note, cardiac vagal tone starts to rise (arrow) earlier than the annotated transition to N3 (red dashed line). (C) A “blow-up” of the EEG of three 30-s periods, indicated by brown horizontal bars, are presented. These include two periods from N2 (one with basal vagal tone, the other with elevated vagal tone), and one period from N3. To better visualize SWA in the EEG, we plot, underneath the raw EEG, one intrinsic mode function (IMF) that corresponds to the oscillatory component in the 0.3–1 Hz band. This plot shows that SWA appears, albeit with lower amplitude, prior to the N3 transition. (D) An EMD-based SWA amplitude is computed and plotted for the 12-min period. An algorithm was developed to identify the “transition point” (green vertical dashed line) when SWA starts to emerge. This SWA transition point appeared much earlier than the N2 to N3 transition (red dashed line). As we will show, this transition point that is associated with cardiac vagal tone transition (SWA usually rises about 2 min earlier than the elevation of vagal tone), and suggests that the EMD analysis of SWA provides a physiologically relevant definition of slow wave sleep.

