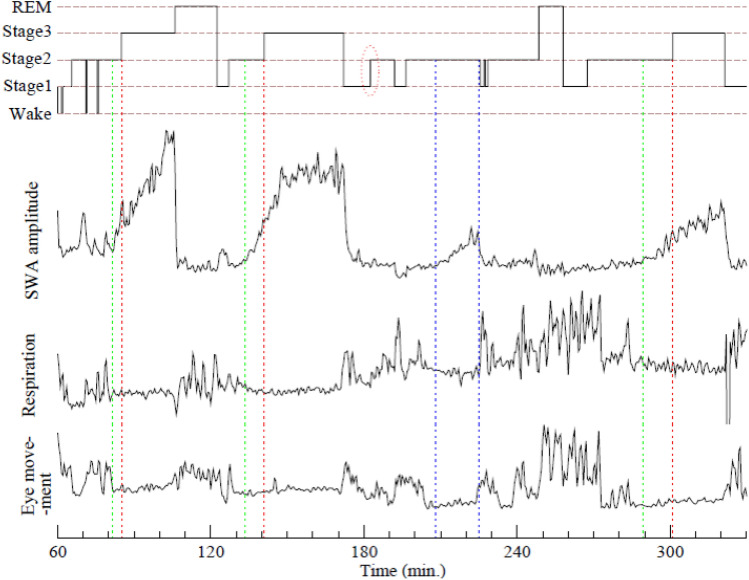
Figure 4.
A typical sleep stage annotation of a 4.5-h sleep period is shown in the top panel. In the other three panels, amplitude of SWA, respiration (amplitude of breathing flow), and eye movements (amplitude of EOG signal) during the same period are plotted. Three dotted red lines mark transitions from N2 to N3 according to AASM criteria. SWA amplitude consistently increased prior to these transitions and our algorithm identifies the earlier transition points (green lines) when SWA emerges and becomes dominant. We hypothesize that these transition points identify when synchronized networks of neurons are formed, and might represent a more meaningful transition to slow wave sleep (SWS) as this is concordant with other physiologic variables, as evidenced by the lower two panels. The two blue lines identify an SWS period inside a conventional N2 stage.

