
Figure 5.
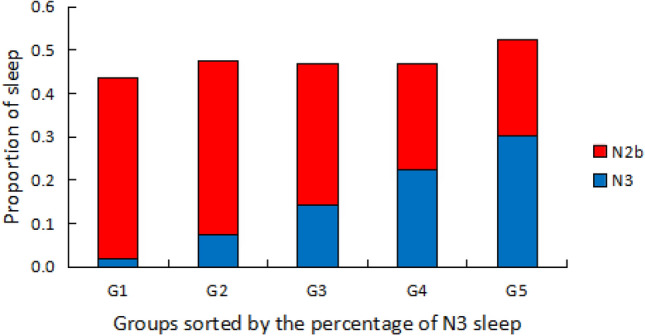
Forty six healthy elderly subjects were divided into 5 quintiles according to percentage of N3 sleep. Group 1 has the lowest amount of N3 sleep, and group 5 has the highest. The average percentages of N3 sleep for each group are plotted in blue. The ‘hidden’ slow wave sleep (SWS) periods in N2 sleep, denoted as N2b, uncovered by our algorithm are plotted in red. Note, as the amount of N3 sleep increases from group 1 to 5, the amount of N2b decreases, leading to an almost constant percentage of the sum of N3 and N2b of 45–50% across all 5 subgroups. The proportions of SWS in NREM sleep of these 5 subgroups are not statistically different (p > 0.9, One-way ANOVA).