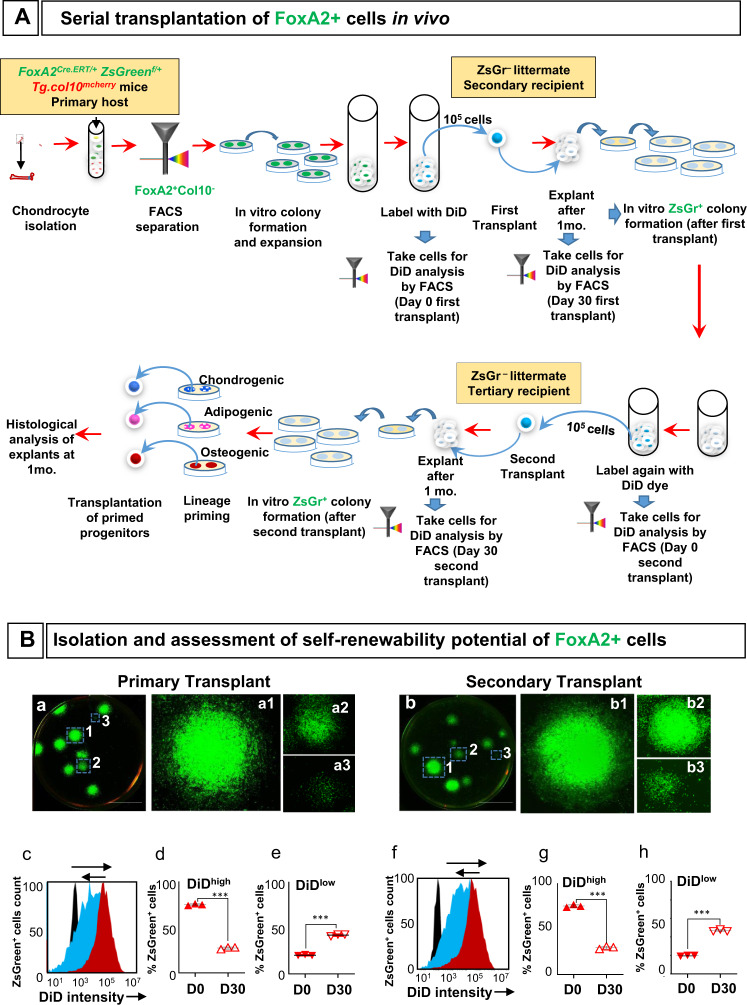
Fig. 5. Serial transplantation of FoxA2+ cells in vivo.
A Experimental strategy for the isolation and assessment of self-renewability and differentiation potential of FoxA2+ cells in vivo. B Representative images of colonies derived from FoxA2+ cells isolated from primary (a) and secondary transplants (b). Scale bars, 1 cm. DiD fluorescence intensity histogram profiles at Day 0 (red), Day 30 (blue), and negative control (black) from primary (c) and secondary (f) transplants. Percentage of DiDhigh cells in the FoxA2+ cells from primary (d) and secondary (g) transplants. Percentage of DiDlow cells in the FoxA2+ cells from primary (e) and secondary (h) transplants. Data are presented as mean ± SD for each group, n = 3 mice. The asterisks indicate significant difference: two-tailed Student’s unpaired samples t test; ***p = 7.0148E−07 (DiDhigh primary transplant D0 vs D30), 7.84512E−06 (DiDlow primary transplant D0 vs D30), 3.32176E−06 (DiDhigh secondary transplant D0 vs D30), and 3.46695E−06 (DiDlow secondary transplant D0 vs D30). Complete statistical information is provided in Supplementary Table 1.

