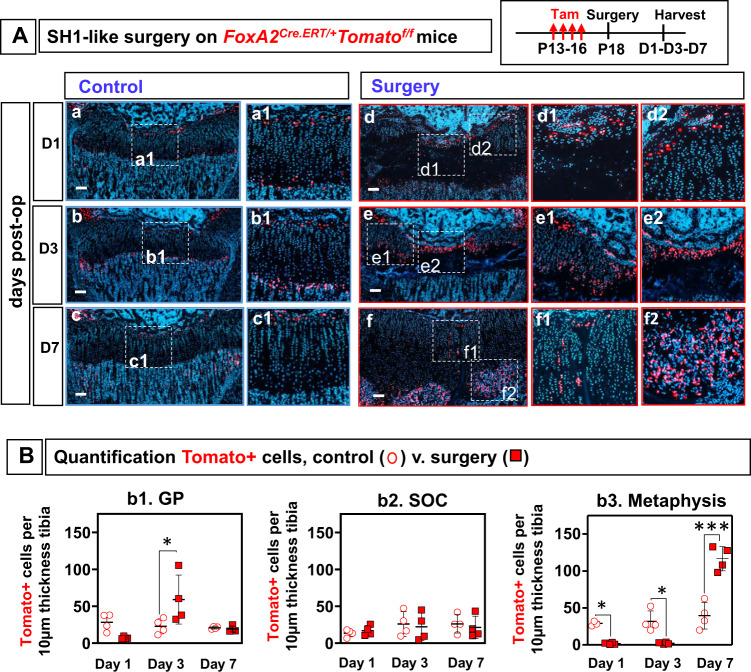
Fig. 7. FoxA2+ cells expand in response to SH1 (Salter–Harris type 1)-like surgery.
A Control (a–c) and operated (d–f) tibia from FoxA2CreERT2/+;Tomatofl/fl mice, injected with tamoxifen P13-P16, operated via SH1-like surgery at P18, and harvested at 1-, 3-, 7-day post-op. Tomato fluorescence (red), Hoechst (blue). Insets, magnified view of injury (d1–2, e1–2, f1–2) or control (a1, b1, c1). Scale bars, 100 µm. B Quantification FoxA2+(Tomato+) cells at d1, d3 and d7 post-op in the GP (b1), SOC (b2), and metaphyseal bone (b3), in tibial sections from control (open circles) and operated (closed squares) limbs. The number of Tomato+ cells in the metaphyseal bone (MB) is counted in an area extending 100 µm away from the GP/MB interface, towards the MB. The number of Tomato+ cells in the SOC is counted in an area extending 100 µm away from the GP/SOC interface, towards the SOC. The number of Tomato+ cells in the GP is counted in an area extending 100 µm away from the GP/SOC interface, towards the GP. Each point represents an average of n = 3 sections collected from the lesion area, per hindlimb. Data are presented as mean ± SD of n = 4 mice. The asterisks indicate significant difference: One-way ANOVA, Tukey test; *p = 0.032625 (Day 3: control vs surgery, GP), 0.03613 (Day 1: control vs surgery, Metaphysis), 0.021045 (Day 3: control vs surgery, Metaphysis), ***p = 0.0000003 (Day 7: control vs surgery, Metaphysis). Complete statistical information is in Supplementary Table 1.

