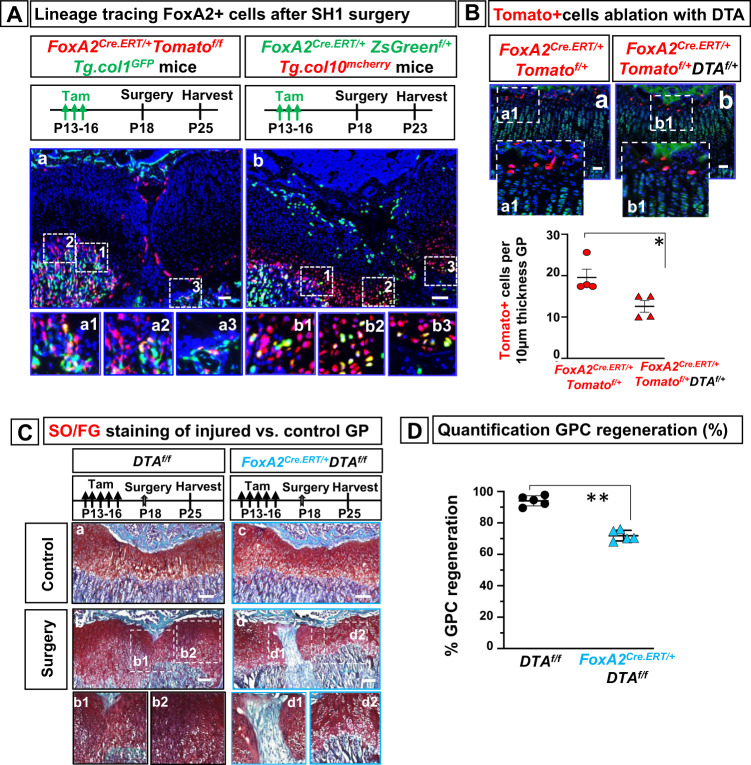
Fig. 8. Ablation of FoxA2+ cells impairs cartilage regeneration.
A Tibia sections from FoxA2CreERT/+; Tomatofl/+;Tg.col1GFP mice treated with tamoxifen (Tam) P13-P16, operated via Salter–Harris type 1 (SH1)-like surgery at P18, harvested at 7 days post-op (a). Representative details from the metaphyseal bone in numbered insets (a1–3). Tibia sections from FoxA2Cre.ERT/+; ZsGreenf/+;Tg.col10mcherry mice treated with tamoxifen P13-P16, operated via SH1-like surgery at P18, and harvested 5 days post-op (b). Representative details from the hypertrophic zone in numbered insets (b1-3). Scale bars are 100 µm. B Tibia sections harvested from FoxA2CreERT/+;Tomatofl/+ (a) and FoxA2CreERT/+;DTAf/+;Tomatofl/+ (b) mice treated with tamoxifen P13-P16, harvested at P18. Hoechst dye (blue), 5-DTAF (green). Insets, magnified view of the FoxA2+ cells visualized by Tomato fluorescence microscopy (red) (a1, b1). Scale bars 50 µm. Quantification of Tomato+ cells, per 10 µm tibial section of GP tissue, from FoxA2CreERT/+; Tomatofl/+ and FoxA2CreERT/+; DTAf/+; Tomatofl/+ mice. Data are presented as mean ± SD of n = 4 mice. The asterisks indicate significant difference: Two-tailed Student’s unpaired samples t test; *p = 0.028571 (FoxA2CreERT/+; Tomatofl/+ vs FoxA2CreERT/+; DTAf/+; Tomatofl/+). C Safranin O/Fast Green staining of tibia sections from control DTAf/f mice (a, b) and FoxA2CreERT/+; DTAf/f mice (c, d), treated with tamoxifen P13-P16, operated at P18 and harvested 7 days after injury. Insets, magnified view of the injury callus in FoxA2CreERT/+; DTAf/f mice (d1, d2), or DTAf/f mice (b1, b2). Scale bars are 100 µm. D Image J quantification of GP cartilage regeneration after surgery in FoxA2CreERT/+; DTAf/f mice compared with DTAf/f mice. Percentage (%) cartilage regeneration is calculated by dividing the area of SafraninO+ GP cartilage to the total GP cartilage area (injured plus healthy). Data are presented as mean ± SD, n = 5 mice. The asterisks indicate significant difference: Two-tailed Student’s unpaired-samples t test; **p = 0.007937 (FoxA2CreERT/+; DTAf/f vs DTAf/f). Complete statistical information is provided in Supplementary Table 1.

