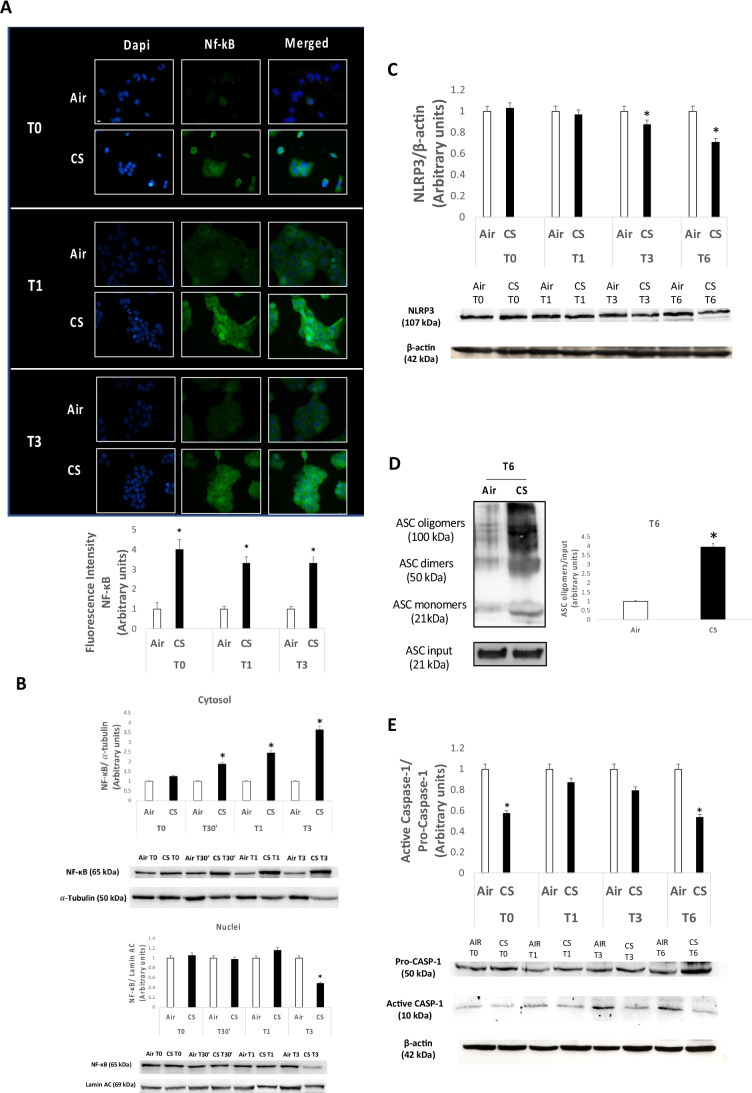
Figure 2.
(A) Immunocytochemical analysis of NF-κB in HaCaT cells exposed to CS for 15 min compared to ctrl samples (air), 0, 1, and 3 h (T0, T1, and T3) upon the end of 15-min CS exposure. Green staining represents NF-κB, while DAPI fluorescent stain (blue staining) was used to counterstain the cell nuclei. Pictures were taken at 40 × magnification; scale bar = 20 μm. Fluorescence intensity for NF-κB was measured using ImageJ software. (B) Protein expression levels of NF-κB in cytosol (upper panel) and nuclei (below panel) in HaCaT cells exposed to CS for 15 min and collected at the selected time points starting from the end of the CS insult, with relative expression level quantification. α-Tubulin and lamin A/C were used as loading control for cytoplasm and nuclei fractions respectively. ImageJ software was used for the analysis. (C) Protein expression levels of NLRP3 in HaCaT samples exposed to CS and collected 0, 1, 3, and 6 h post 15 min of CS exposure. The NLRP3 expression level was quantified using ImageJ software and β-actin was used as internal control. (D) ASC oligomer levels in HaCaT samples 6 h (T6) post 15-min CS exposure with relative expression level quantification. β-Actin was used as internal control. (E) Protein expression levels of caspase-1 0, 1, 3, and 6 h (T0, T1, T3, and T6) after 15 min of CS exposure in HaCaT cells. The upper panel displays the quantification of the ratio between active caspase-1 and pro-caspase-1; ImageJ software was used for the analysis. Data are the results of the averages of at least three different experiments, *p < 0.05 by one-way ANOVA

