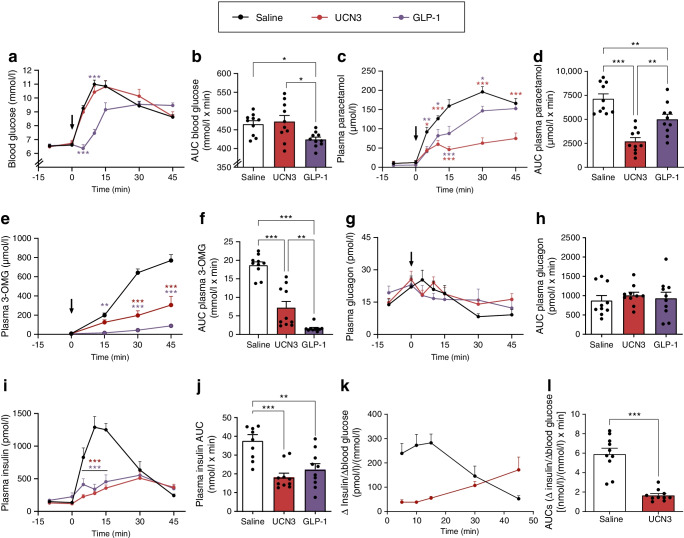
Fig. 1.
Effects of UCN3 on blood glucose, gastric emptying and glucose-stimulated secretion of insulin and glucagon in the rat. Response to an oral challenge with glucose (2 g/kg) in combination with s.c. injection of vehicle, UCN3 (adjusted dose 7.5 nmol/kg) or GLP-1 (30 nmol/kg, positive control). Glucose and s.c. stimuli were both administered at 0 min (indicated by arrow). Baseline samples were taken at −10 min and 0 min. Plots of variables over time are shown, with respective AUCs, for blood glucose (a, b), plasma paracetamol (c, b), plasma 3-OMG (e, f), plasma glucagon (g, h), plasma insulin (i, j) and ∆insulin/∆blood glucose ratio (k, l). Data are shown as means + SEM, n = 10. *p<0.05, **p<0.01 and ***p<0.001 (two-way ANOVA followed by Tukey’s multiple comparison test, testing groups against vehicle [a, c, e, g, i], one-way ANOVA followed by Tukey’s multiple comparison test [b, d, f, h, j] or, in l, paired t test). ∆insulin values in (k) and (l) were calculated by subtracting baseline values (mean of −10 min and 0 min values) from subsequent values. AUCs covered −5 min to 45 min (b, d, h, j), 5–45 min (f) or 5–30 min (l). Arrows indicate time point of OGTT and compound administration

