Fig. 4.
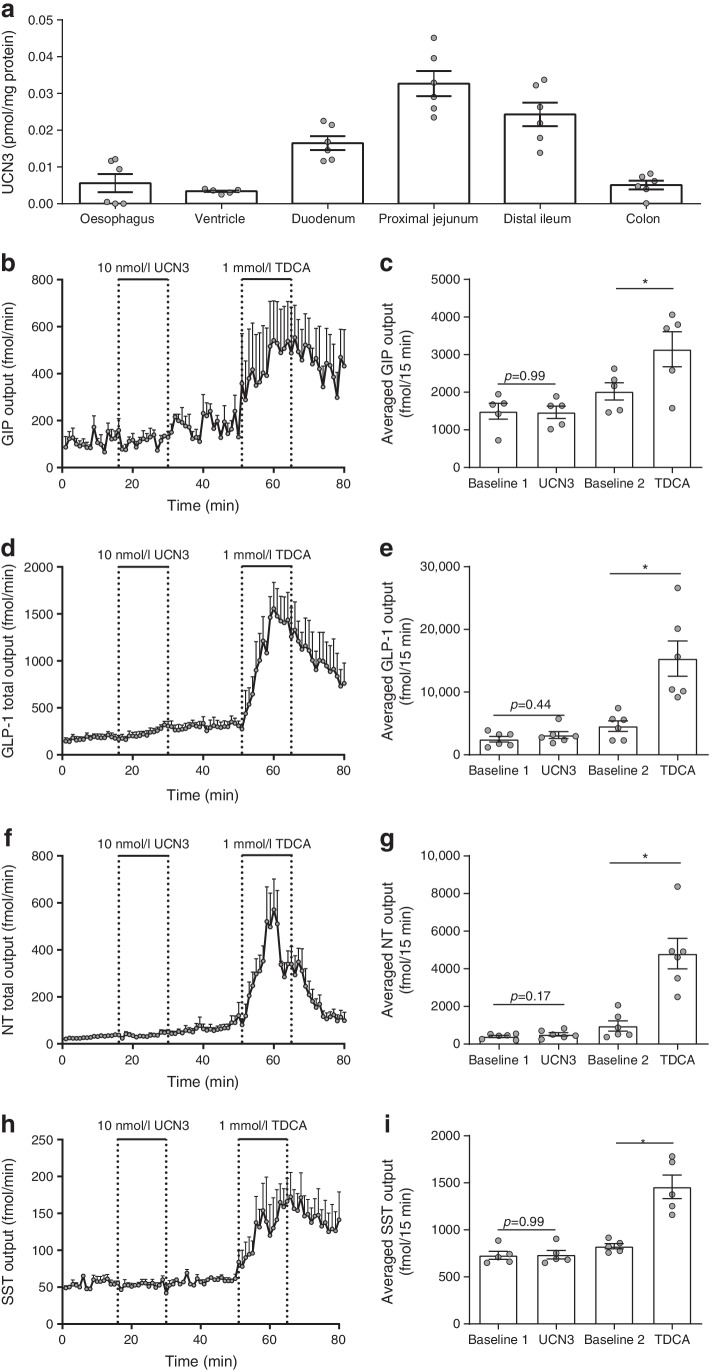
Concentrations of UCN3 along the rat intestine and effects of UCN3 on secretion of glucoregulatory hormones from isolated perfused rat small intestines. (a) Extractable UCN3 concentrations in rat oesophagus to colon. (b–i) Secretion of GIP (b, c), GLP-1 (d, e), NT (f, g) and SST (h, i) in response to arterial infusions of UCN3 (10 nmol/l) or taurodeoxycholic acid (1 mmol/l, positive control). Secretion is plotted as min–min outputs and as respective average total output during the stimulation periods (15 min). Data are presented as means ± SEM, n = 6. *p<0.05 (one-way ANOVA for repeated measurements followed by Tukey post hoc test). TDCA, taurodeoxycholic acid

