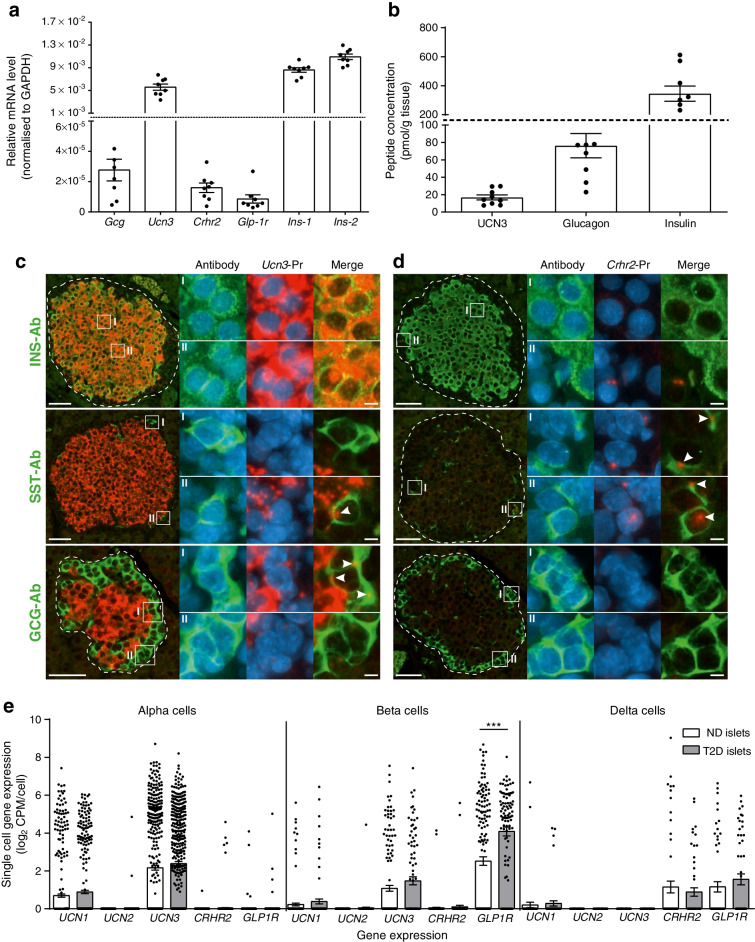
Fig. 6.
Extractable UCN3, glucagon and insulin concentrations in rat pancreas and expression of Gcg, Ucn3 and Crhr2 in rat islets and in islets from human donors with or without type 2 diabetes. (a) Expression of Gcg, Ucn3, Crhr2, Glp-1r, Ins-1 and Ins-2 in rat islets (quantified by real-time quantitative PCR). n = 8. (b) Concentrations of extractable UCN3, glucagon and insulin in rat pancreas. n = 9. (c, d) Representative images of fluorescence in situ hybridisations of pancreatic islets stained for Ucn3 (c) or Crhr2 (d) mRNA (red) and cells immunofluorescence-stained with antibodies against insulin, glucagon and SST (green) with blown-up areas indicated by I and II. Arrowheads indicate overlap between peptide hormone staining and mRNA staining. Nuclei are counterstained with DAPI (blue). Scale bar, 50 μm (5 μm in blown-up image). n = 3 male rats. (e) Single-cell expression of genes encoding UCN1–3, CRHR2 and GLP1R in human islets from donors with or without type 2 diabetes. Circles show expression in respective single cells (no. of cells from non-diabetic/diabetic donors: alpha cells 443/443; beta cells 171/99 and delta cells 59/55) and bars indicate mean ± SEM expression levels in respective cell populations. Cells with a read count per million kilobases (RPKM) > 0 were considered positive. Data are shown as means ± SEM, n = 6 islets (non-diabetic) or 4 islets (diabetic). ***p<0.001 (one-way ANOVA followed by Tukey post hoc test). Ab, antibodies; GCG, glucagon; INS, insulin; ND, non-diabetic; Pr, probes; T2D, type 2 diabetes

