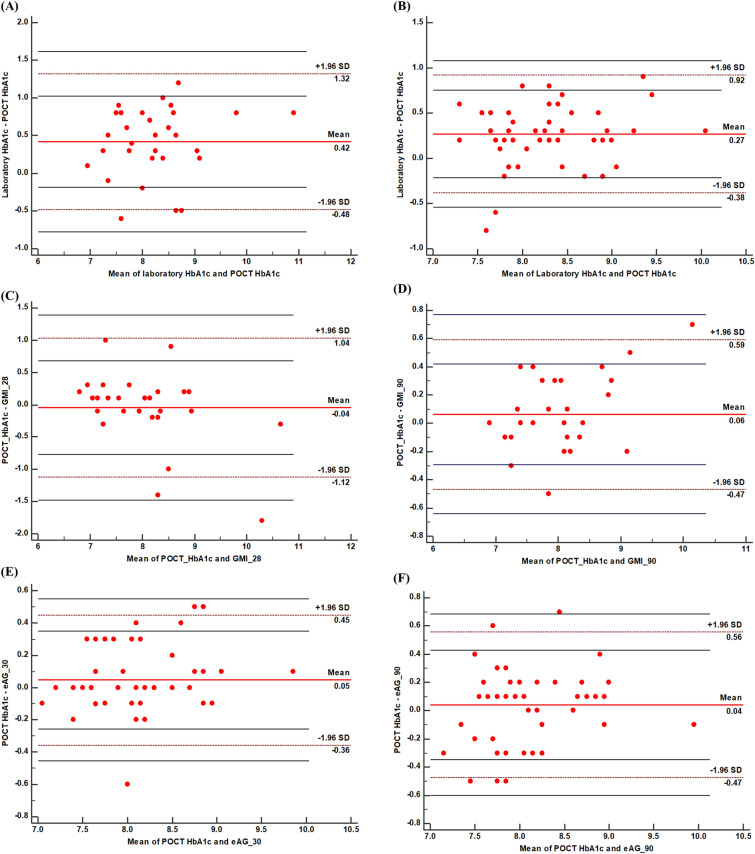
Fig. 2.
Bland-Altman plot for the agreement between POCT-HbA1c with Lab HbA1c and estimated HbA1c by isCGM or conventional SMBG. A Limit of agreement between the laboratory HbA1c and the POCT-HbA1c in isCGM users. B Limit of agreement between the laboratory HbA1c and the POCT-HbA1c in Conventional SMBG users; C Limit of agreement between the POCT-HbA1c and GMI-28 in isCGM users. D Limit of agreement between the POCT-HbA1c and GMI-90 in isCGM users. E Limit of agreement between the POCT-HbA1c and eAG-30 in conventional SMBG users. F Limit of agreement between the POCT-HbA1c and eAG-90 in conventional SMBG users

