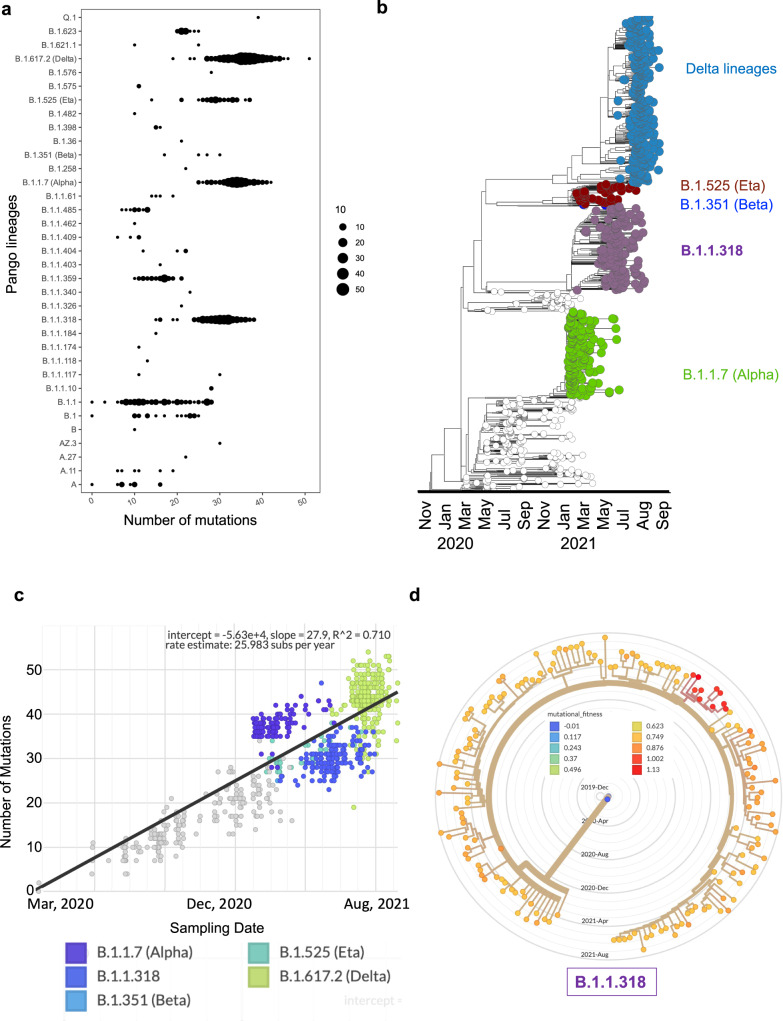
Fig. 3. Genetic diversity and molecular evolutionary relationships of variants identified in Ghana.
a The spread/range and magnitude of mutation per lineage (n = 1002). Each filled circle represents a sample, and the circle’s width is proportional to the number of mutations present in a particular sample. b Maximum likelihood phylogenetic tree with ancestral state reconstruction in a backdrop of reference sequences from Wuhan and evolutionary relationship of the Ghanaian variants over time (n = 1002). Colours show the VOC; Delta lineages, Alpha, B.1.1.318, and Beta, based on Nextstrain’s emerging lineages designations. c Root-to-tip divergence as a function of sampling time. The Y-axis denoted divergence (the number of mutations in the genome relative to the root), and the X-axis shows the sampling date of each genome. d Annotated mutational fitness of all the B.1.1.318 lineage in Ghana; the samples with the highest fitness are coloured red.

