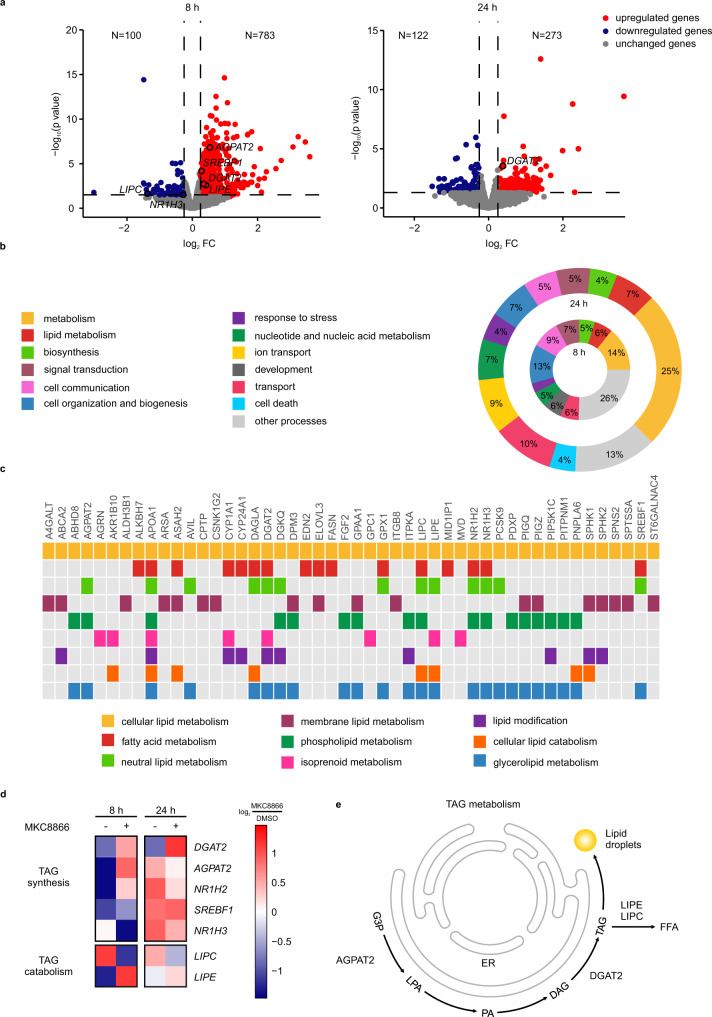
Fig. 2. IRE1α signaling modulates expression of genes involved in TAG metabolism.
a–c MDA-MB-231 cells were treated with 20 µM MKC8866 or DMSO for 8 and 24 h after which RNA was extracted and RNA sequencing analysis performed (n = 3 biologically independent experiments). Pairwise comparison MKC8866/DMSO was performed with edgeR for identification of differentially expressed genes (DEGs) at each time point (no multiple comparison adjustments were performed). a Volcano plots showing fold changes and −log10(p-value) for genes differentially expressed between MKC8866 and DMSO treated cells at 8 and 24 h. Blue indicates downregulated genes and red indicates upregulated genes upon MKC8866 treatment (p < 0.05). b Summary of a functional analysis of DEGs at 8 and 24 h time points. Overrepresented Gene Ontology (GO) terms were summarized into broader biological groups based on semantic similarity with cateGOrizer to facilitate biological interpretation. c Genes termed significantly changing at either of the two time points and annotated to lipid metabolism on the GO database. d Heatmap displaying average expression levels for DEG annotated to TAG metabolism in the GO database. The expression for each gene (row) was centered and scaled so the mean expression is zero and standard deviation is one. e Schematic representation of TAG metabolism, showing TAG metabolism-regulating genes whose expression is altered by IRE1α. G3P glycerol-3-phosphate, LPA lysophosphatidic acid, PA phosphatidic acid, DAG diacylglycerol, TAG triacylglycerol, FFA free fatty acid. Source data are provided as a Source Data file.

