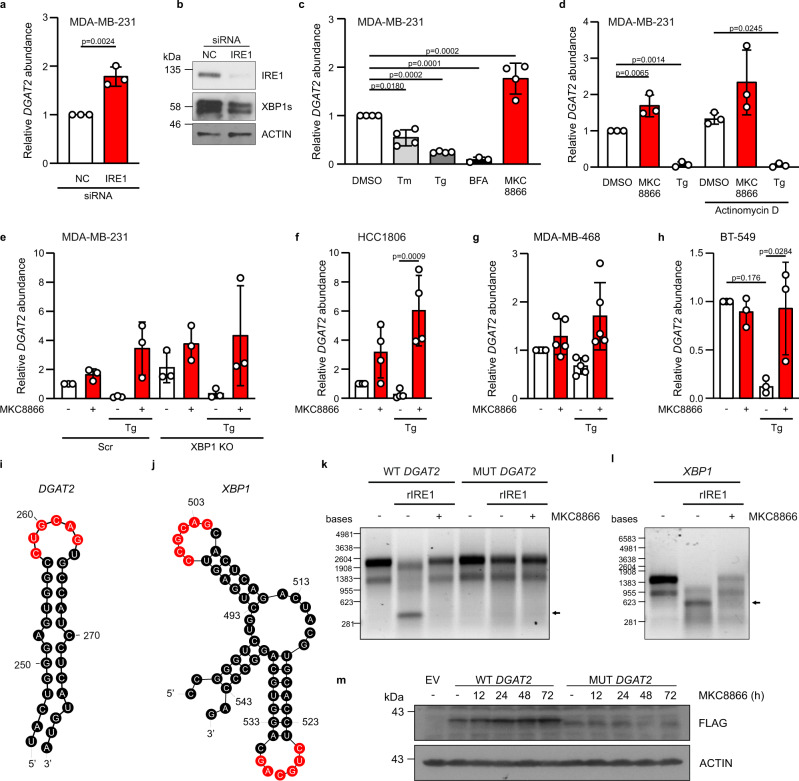
Fig. 3. DGAT2 is an IRE1α RIDD substrate.
a–d MDA-MB-231 cells were either a, b transfected with non-coding (nc) and IRE1 siRNA for 72 h (n = 3 biologically independent experiments), c treated with Tunicamycin (Tm, 5 µg/ml), Thapsigargin (Tg, 0.25 µM), Brefeldin A (BFA, 0.5 µg/ml), MKC8866 (20 µM) for 24 h (n = 4 biologically independent experiments) or d pre-treated with actinomycin D (2 µg/ml) for 2 h followed by incubation of cells with Tg (0.25 µM) and MKC8866 (20 µM) for 8 h (n = 3 biologically independent experiments). e MDA-MB-231 XBP1 knockout (KO) cells were treated with DMSO or 20 µM MKC8866 in the presence or absence of 1 µM Tg (n = 3 biologically independent experiments). RT-qPCR quantification of DGAT2 transcript levels relative to a, c, d MRPLP19 and e ACTB and normalized to control at 0 h time point. b Immunoblotting of total IRE1α, XBP1s and ACTIN. f–h Expression of DGAT2 relative to MRPL19 in f HCC1806 (n = 4 biologically independent experiments), g MDA-MB-468 (n = 5 biologically independent experiments) and h BT-549 cells (n = 3 biologically independent experiments) treated with DMSO or 20 µM MKC8866 in the presence or absence of 1 µM Tg for 24 h. i, j RNAfold prediction of secondary structure of mRNA fragments of i DGAT2 and j XBP1 mRNA. IRE1α consensus cleavage sequences are highlighted in red. k, l In vitro transcribed k wild type (WT) DGAT2, c.260G>A DGAT2 mutant (MUT DGAT2)and l XBP1 mRNAs were incubated with recombinant hIRE1α in the presence or absence of 20 μM MKC8866. Arrows indicate cleavage products (n = 4 biologically independent experiments). m MDA-MB-231 cells stably expressing empty vector (EV), FLAG-tagged wild type DGAT2 (WT DGAT2) or guanine 260 to adenine mutated FLAG-tagged DGAT2 (MUT DGAT2) were treated with 20 μM MKC8866 for indicated time points. Representative immunoblots of FLAG and ACTIN for three biologically independent experiments. Indicated p values, based on a comparison of the two groups using an unpaired two-tailed t test or c–h one-way ANOVA with Bonferroni’s multiple comparisons post hoc tests. Values with p < 0.05 are considered statistically significant. Data are presented as mean values ± s.d. Source data are provided as a Source Data file.

