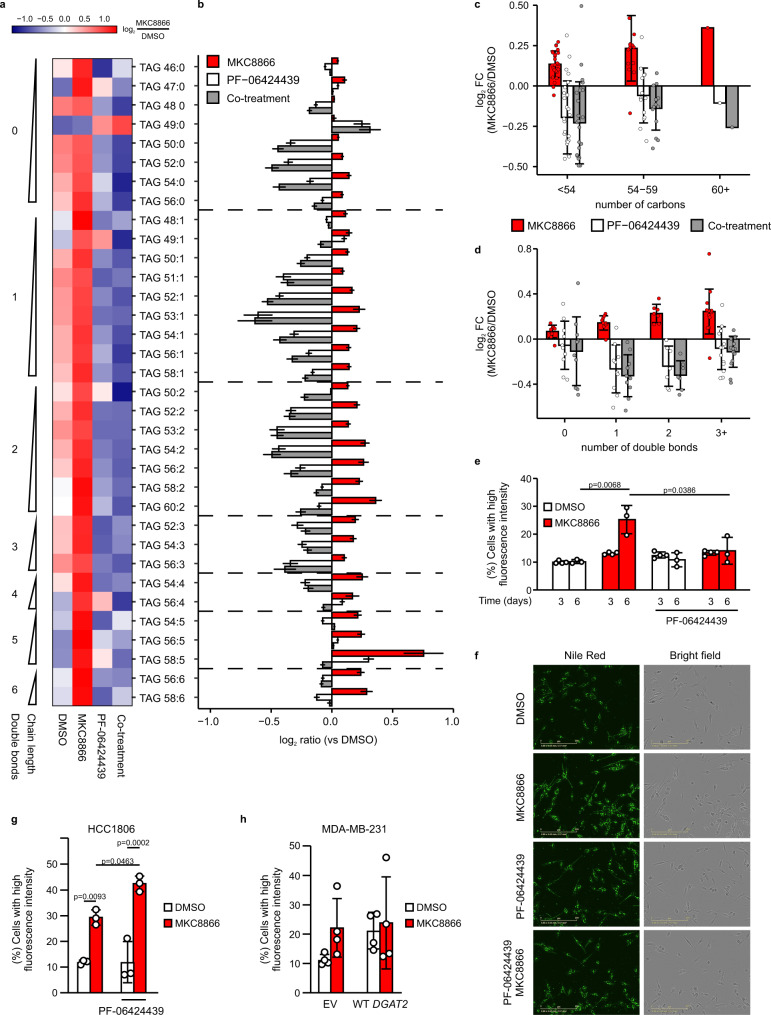
Fig. 4. Inhibition of DGAT2 reverses IRE1α-mediated effect on TAG accumulation.
a–f MDA-MB-231 cells, g HCC1806 (n = 3 biologically independent experiments) and h MDA-MB-231 cells stably expressing EV and WT DGAT2 (n = 4 biologically independent experiments) were treated with 20 µM MKC8866 or vehicle for a–d 3 days, e 3 days (n = 4 biologically independent experiments) and 6 days (n = 3 biologically independent experiments) or f–h 6 days in the presence or absence of 2 µM PF-06424439. a–d Metabolites were extracted and their levels were quantified by LC-MS. a Heatmap showing the average abundance for all measured TAG species (n = 34) across the different treatments. Expression across each row was centered and scaled so the mean expression is zero and standard deviation is one. b Bar charts showing mean of log2 FC versus vehicle-treated cells (DMSO) ± s.e.m. estimated by propagation of error for each treatment and individual TAG species. c and d Graphs displaying log2 FC versus vehicle-treated cells (DMSO) for each treatment for all TAG species grouped by total number of c carbon atoms and d double bonds. Bars indicate mean log2 FC for lipid species within each group ± s.d. e–h Cells were stained with Nile red to visualize and quantify lipid droplets. e, g, h Percentage of cells with a high LD content. f Representative images of MDA-MB-231 cells stained with Nile red after 6 days of treatment (n = 3 biologically independent experiments). Scale bar = 200 µm. Indicated p values based on one-way ANOVA with Bonferroni’s multiple comparisons post hoc tests. Values with p < 0.05 are considered statistically significant. Data are presented as mean values ± s.d. Source data are provided as a Source Data file.

