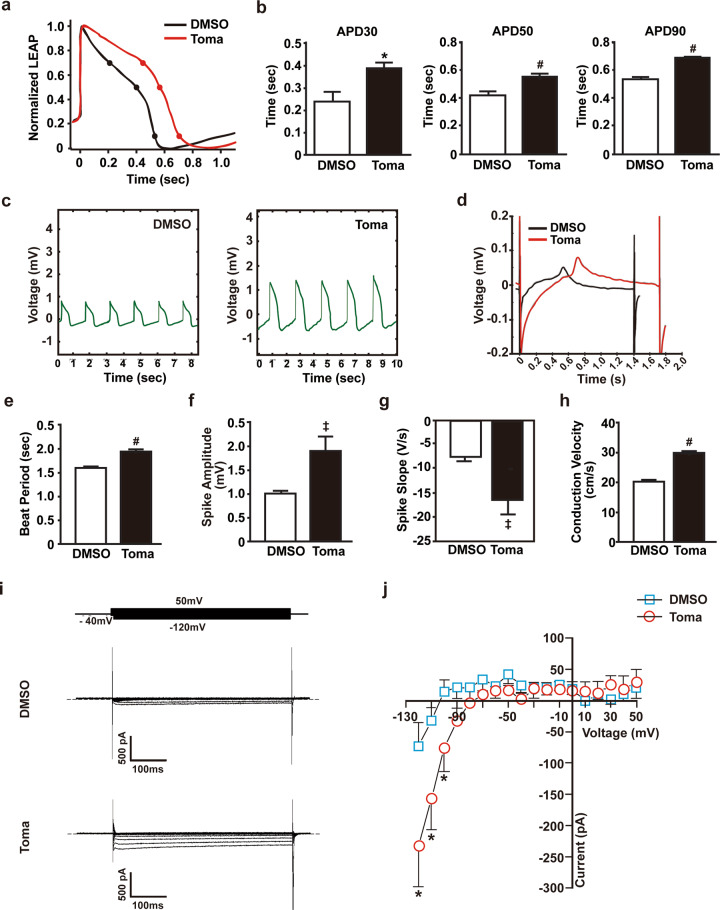
Fig. 5. Electrophysiological properties of tomatidine-treated cardiomyocytes.
a Representative trace of the change in action potential duration during axon cardiac LEAP analysis. b Quantification of APD30, 50, and 90 in the control CMs and Toma-CMs. c Representative beat rate trace of the control CMs and Toma-CMs. d Representative trace of the change in field potential duration during axon cardiac field potential analysis. Quantification of the change in beat period (e), spike amplitude (f), spike slope (g), and conduction velocity (h) in the Day 60 control CMs and Toma-CMs. Data are shown as the mean ± S.D. (n = 3). i Inward-rectifying K+ currents in the control CMs and Toma-CMs. Whole-cell membrane currents were obtained by applying 500 ms test pulses between −120 and 50 mV from a holding potential of −40 mV (see the inset). The Ba2+-sensitive component of whole-cell membrane currents. j Current-voltage relationship of Ba2+-sensitive currents in the control CMs and Toma-CMs. Representative membrane currents (i) and current-voltage relationships (j) were all obtained by averaging the results from seven different cells. Data are shown as the mean ± S.D. *p < 0.05; ‡p < 0.01; #p < 0.001.

