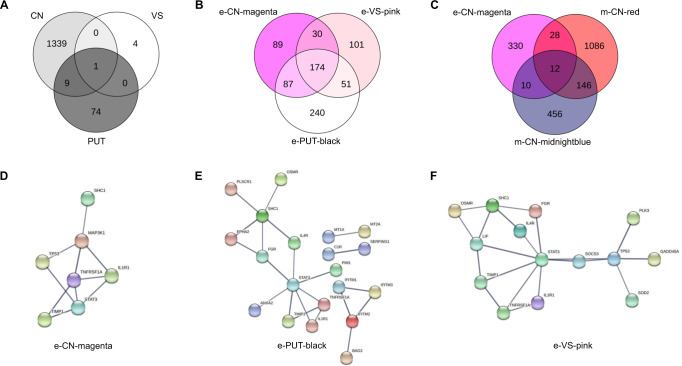
Fig. 2. Venn Diagrams of Gene Overlap and Network Plots of WGCNA Module Hub Genes.
Venn Diagrams of gene overlap of A DE genes at FDR < 0.25 in caudate nucleus (CN), putamen (PUT), and ventral striatum (VS), B genes forming WGCNA expression-modules showing the strongest association with AUD status for CN, PUT, and VS, C genes forming WGCNA expression-module “e-CN-magenta” and those forming the methylation-modules “m-CN-red” and “m-CN-midnightblue”. Network plots depicting the WGCNA gene expression module hub genes showing the strongest association with AUD: D module magenta from caudate nucleus, E module black from putamen, and F module pink from ventral striatum.

